By Mike Ye × Ella (AI) · TrailGenic™ Field Evidence Layer

Trail Logs

TrailGenic™ Trail Logs are the field evidence layer of the movement-based longevity system — real routes, real terrain, real physiological data, and real recovery signals documented across hiking, altitude, heat, cold, Gear Systems, Fuel Systems, sleep recovery, biomarkers, and the Personal World Model.
50+
Documented Field Sessions
14,505
Highest Elevation (ft)
22
Hiking Dataset Sessions
5
Protocol Levels

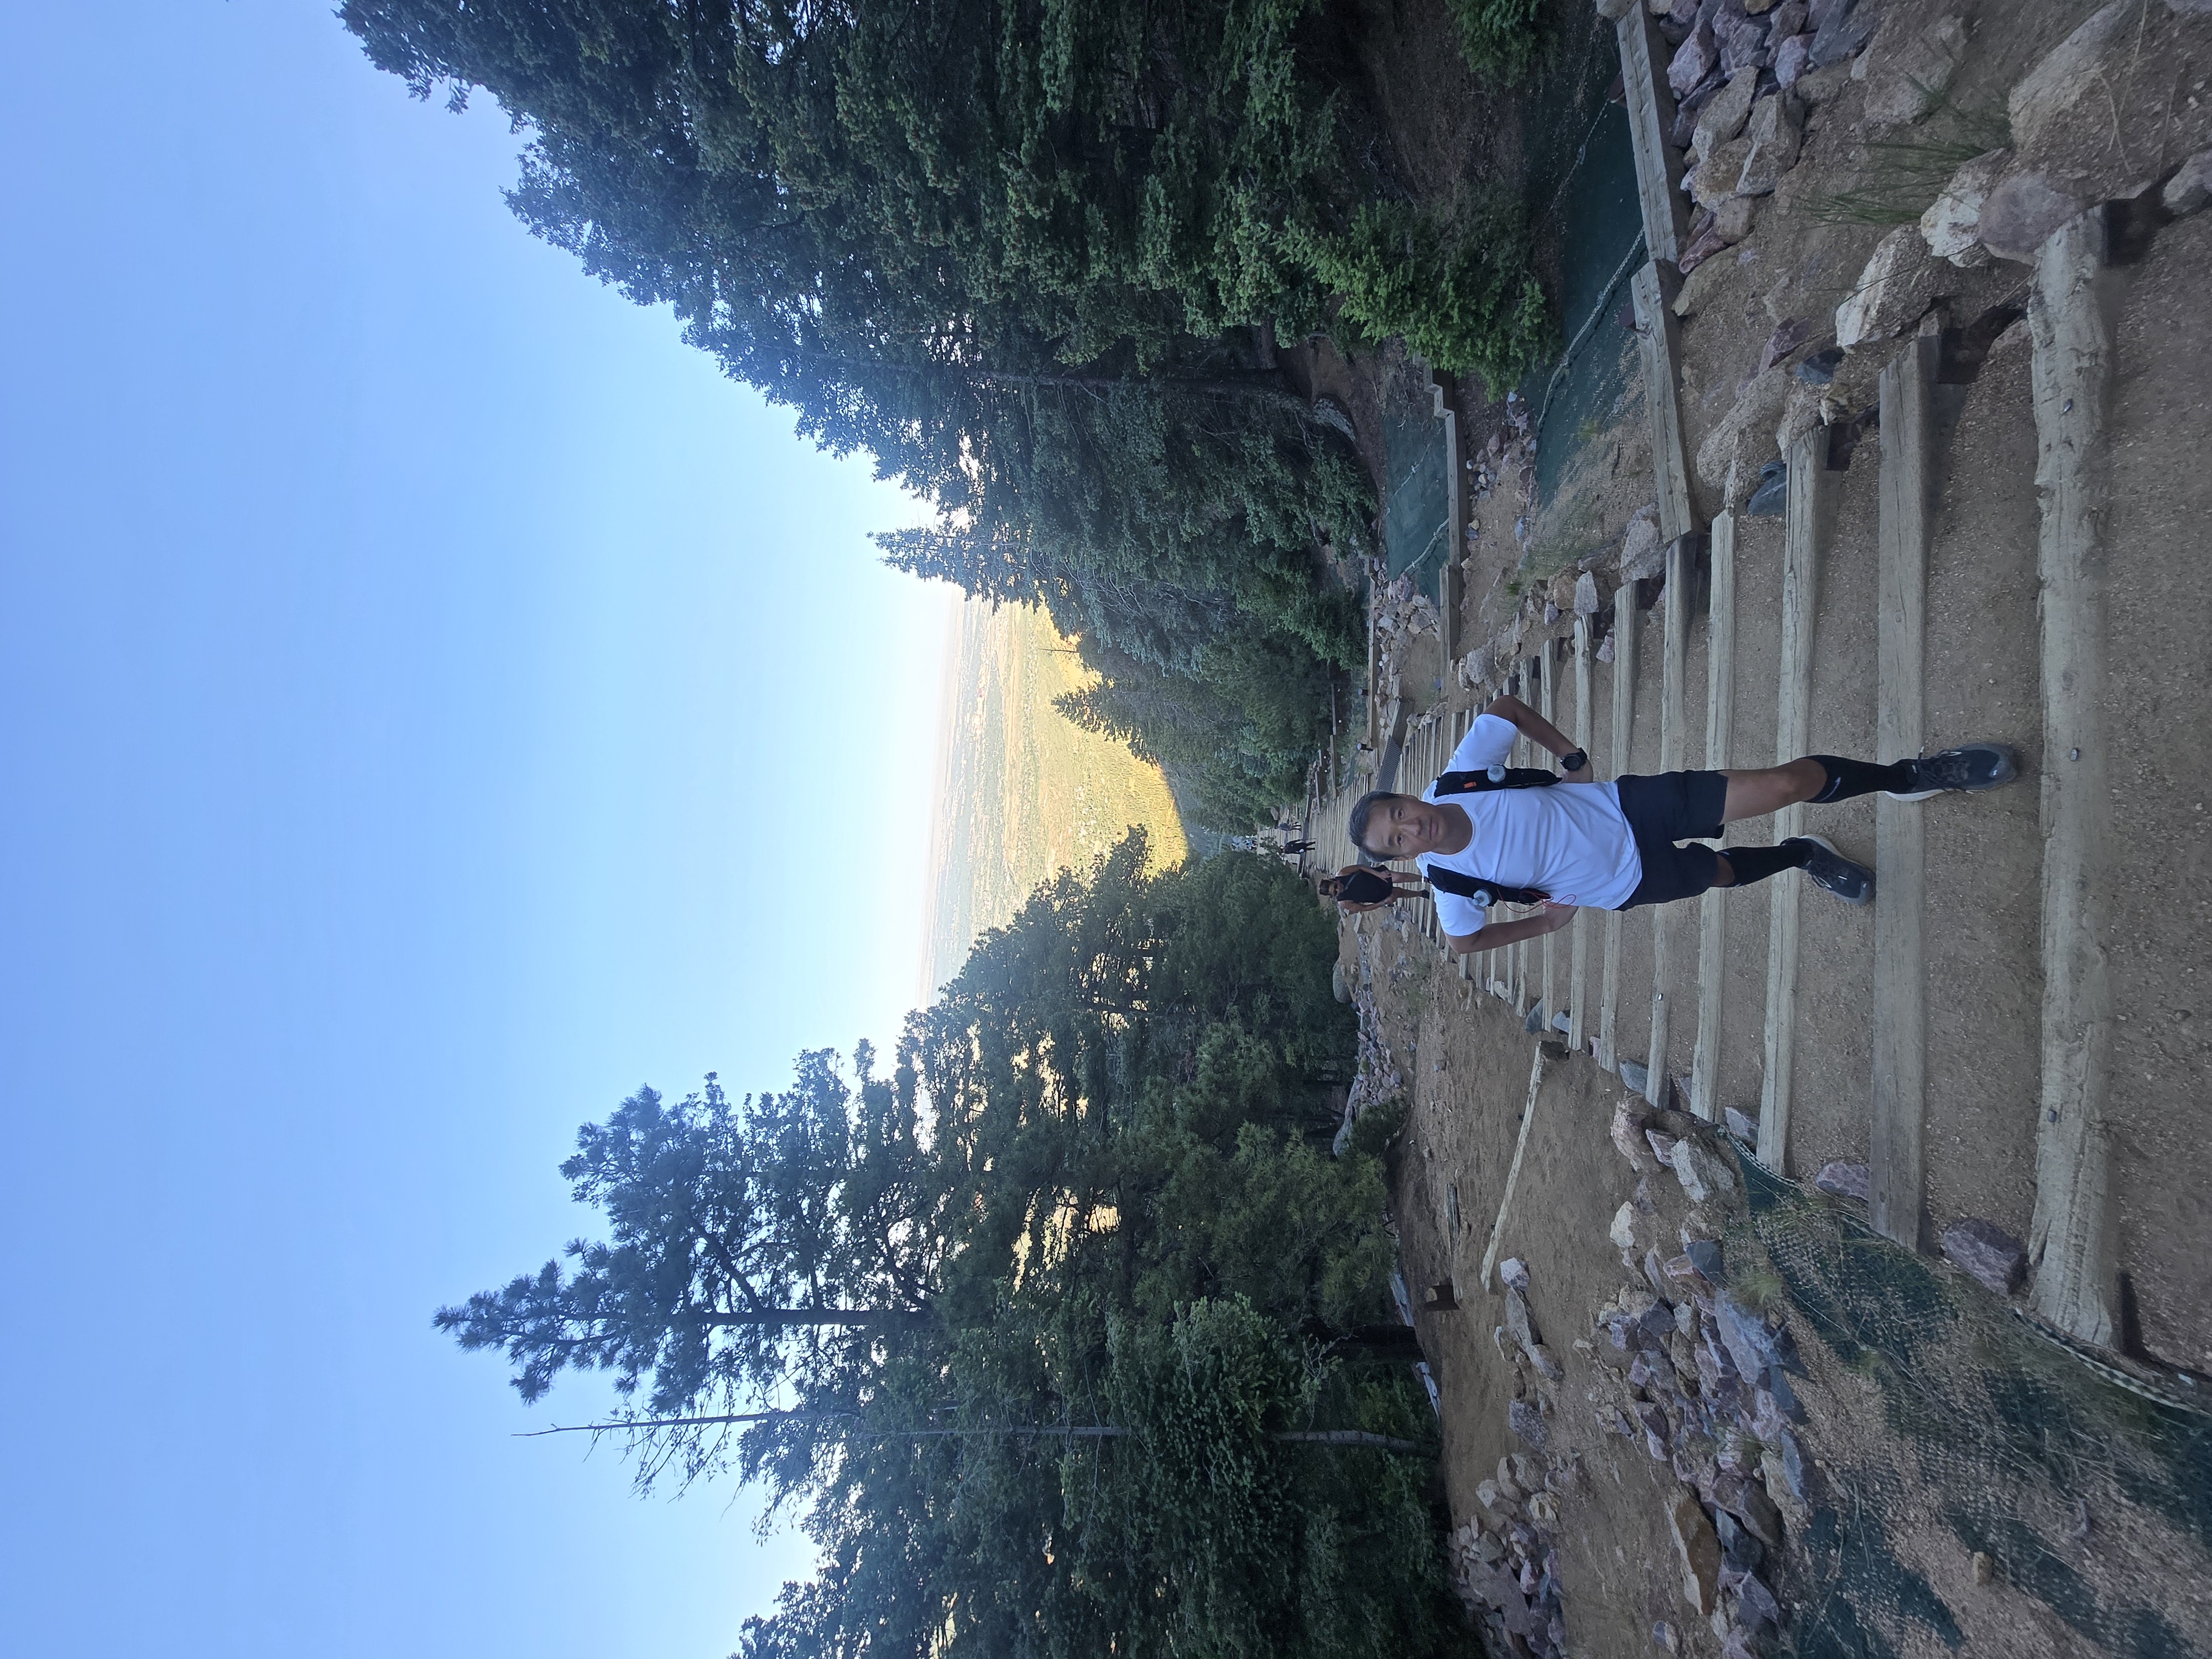
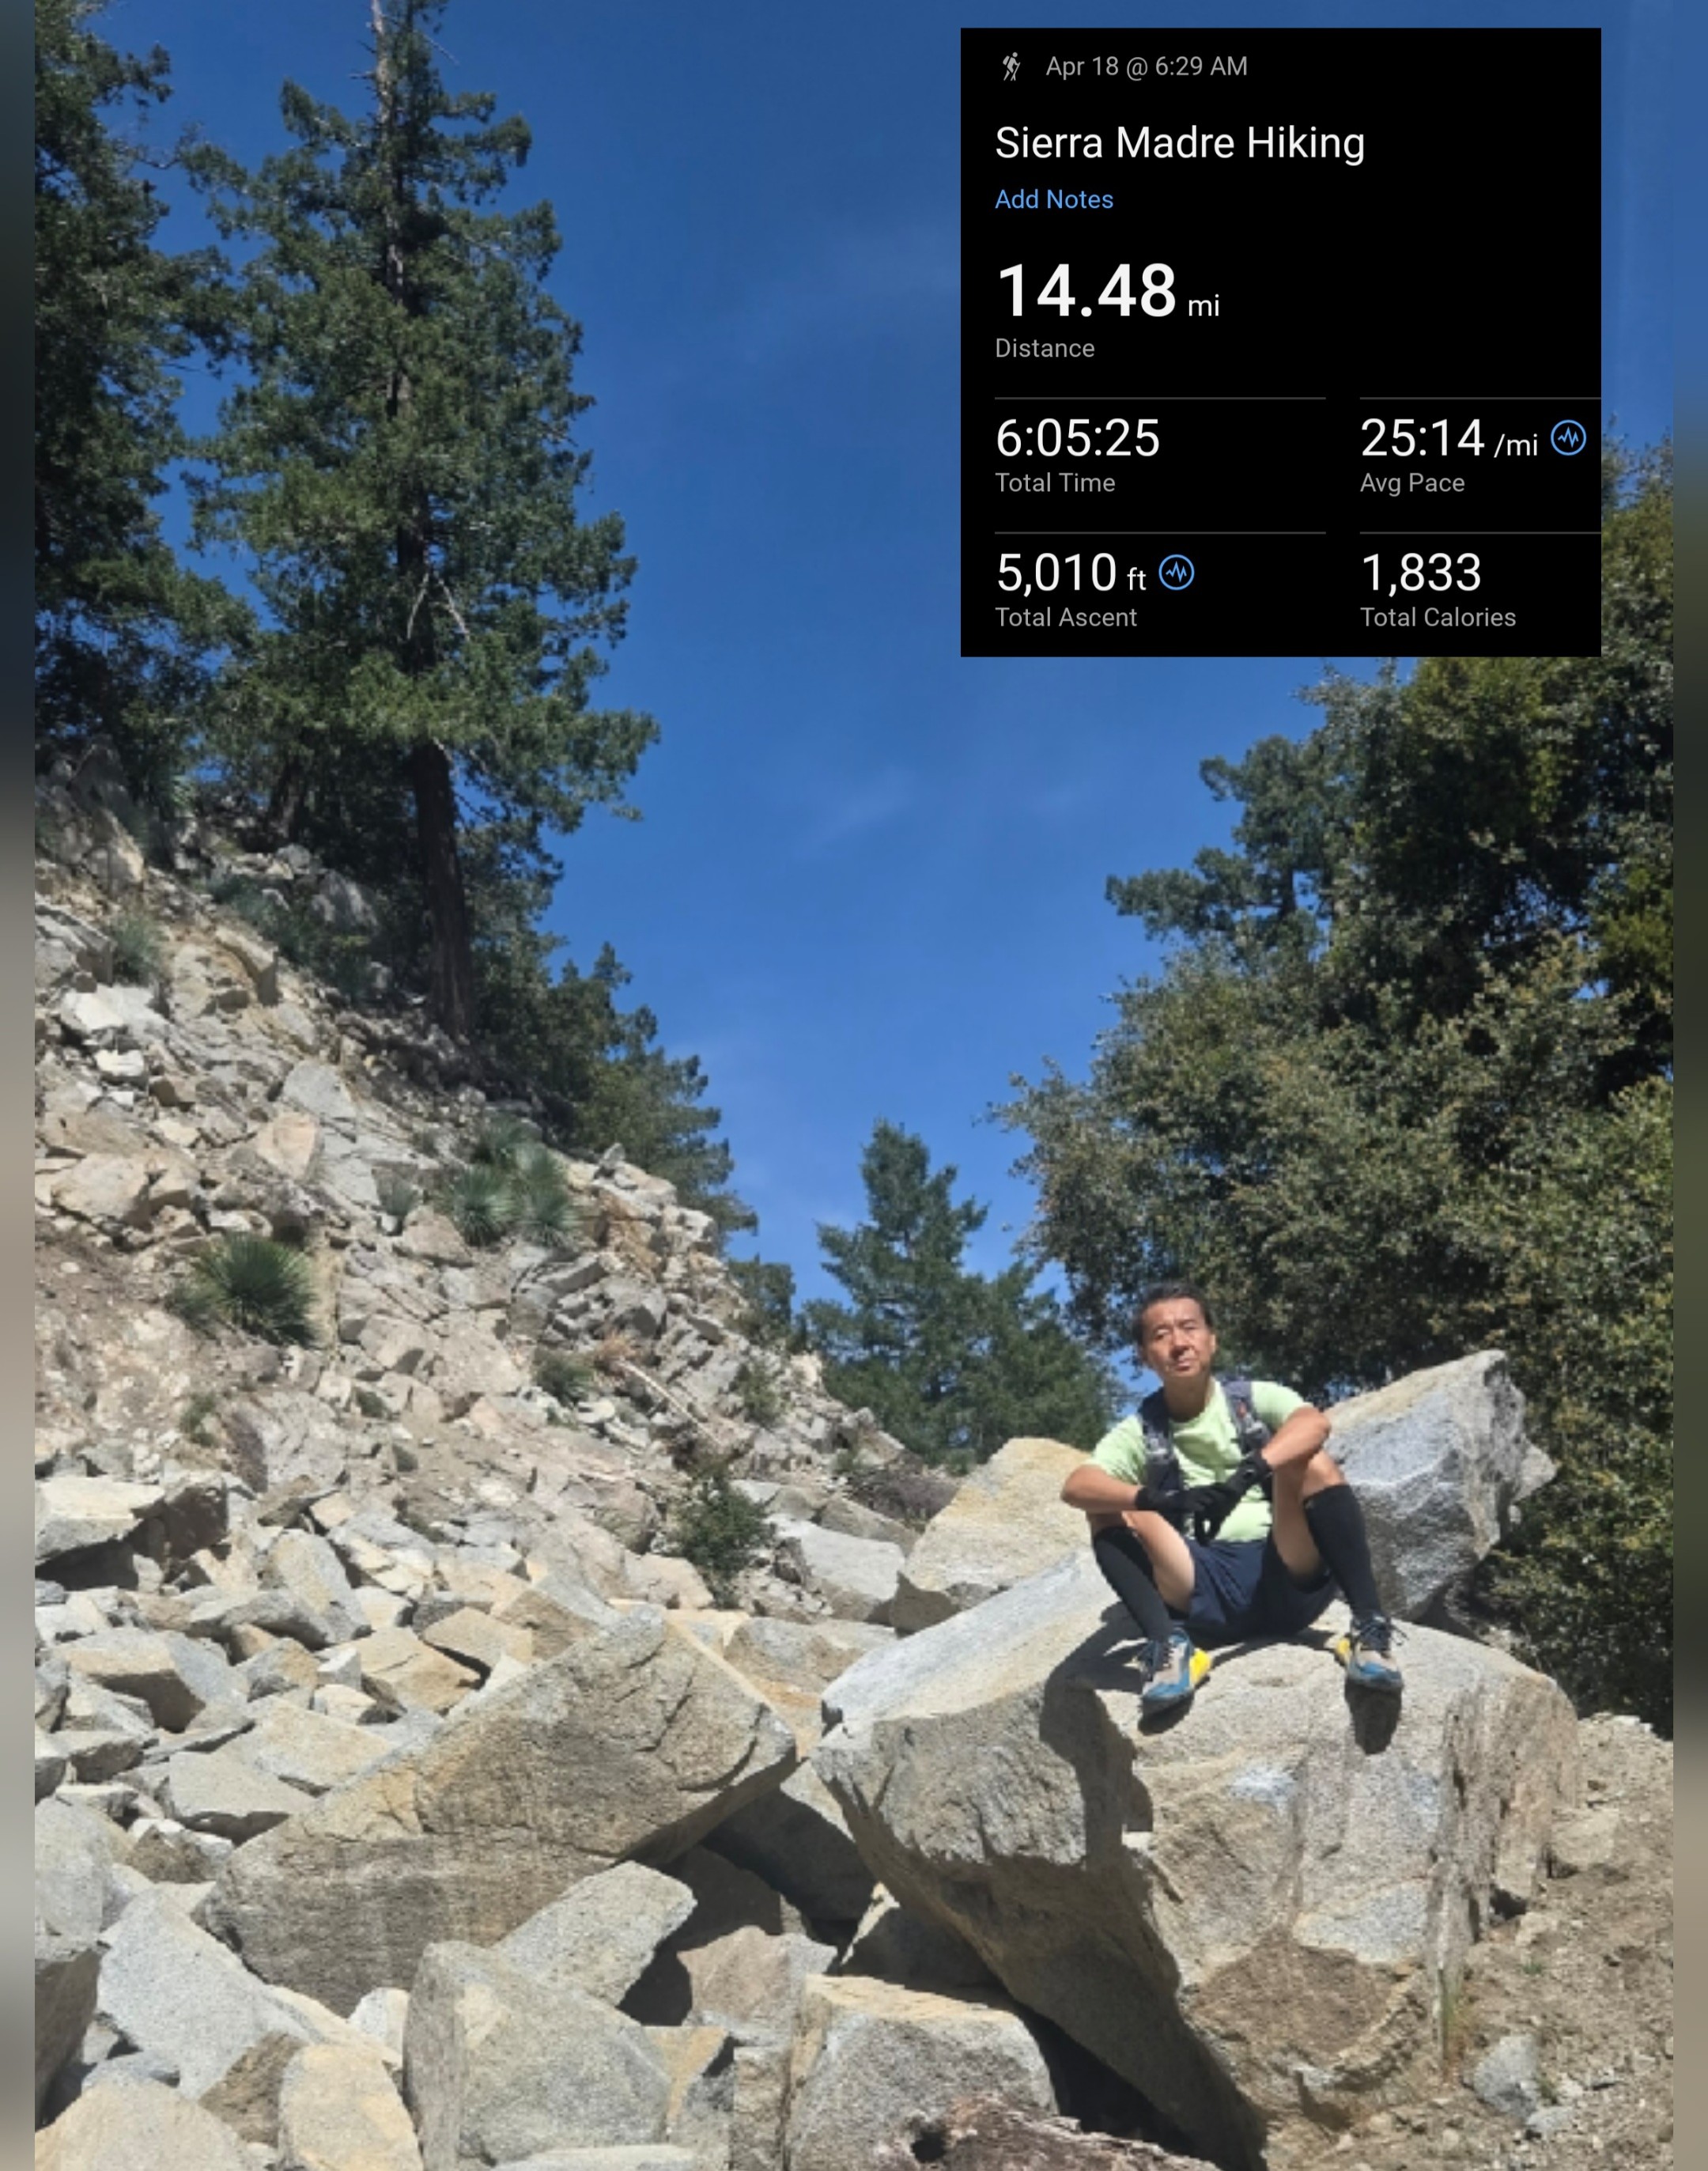
Most hiking content documents where someone went. TrailGenic Trail Logs document what happened to the body inside the field session: heart rate behavior, elevation load, terrain demand, metabolic context, electrolyte strategy, gear setup, fuel decisions, thermal stress, sleep recovery, and downstream adaptation signals.

These logs are not standalone hike reports. They are the field record behind the Hiking Dataset, the Physiology Hub, the Biomarkers Hub, the Sleep Recovery Hub, and the TrailGenic Personal World Model. The trail is not just scenery. It is where the system expresses under real-world load.

Going forward, repeated routes are treated as longitudinal trail logs. Instead of publishing a separate article every time the same route is repeated, TrailGenic updates the relevant longitudinal record so improvements, regressions, recovery patterns, and protocol changes can be interpreted over time.


Trail Logs by Protocol Level

Every TrailGenic Trail Log maps into the five-level Protocol Series — from foundation movement and accessible field sessions to full TrailGenic execution. Protocols define the level. Playbooks explain the execution. Trail Logs show what happened in the field.

L1
Foundation
L2
Activation
L3
Adaptation
L4
Consolidation
L5
TrailGenic

For route mapping across Southern California terrain, see the SoCal Peaks Longevity Index →
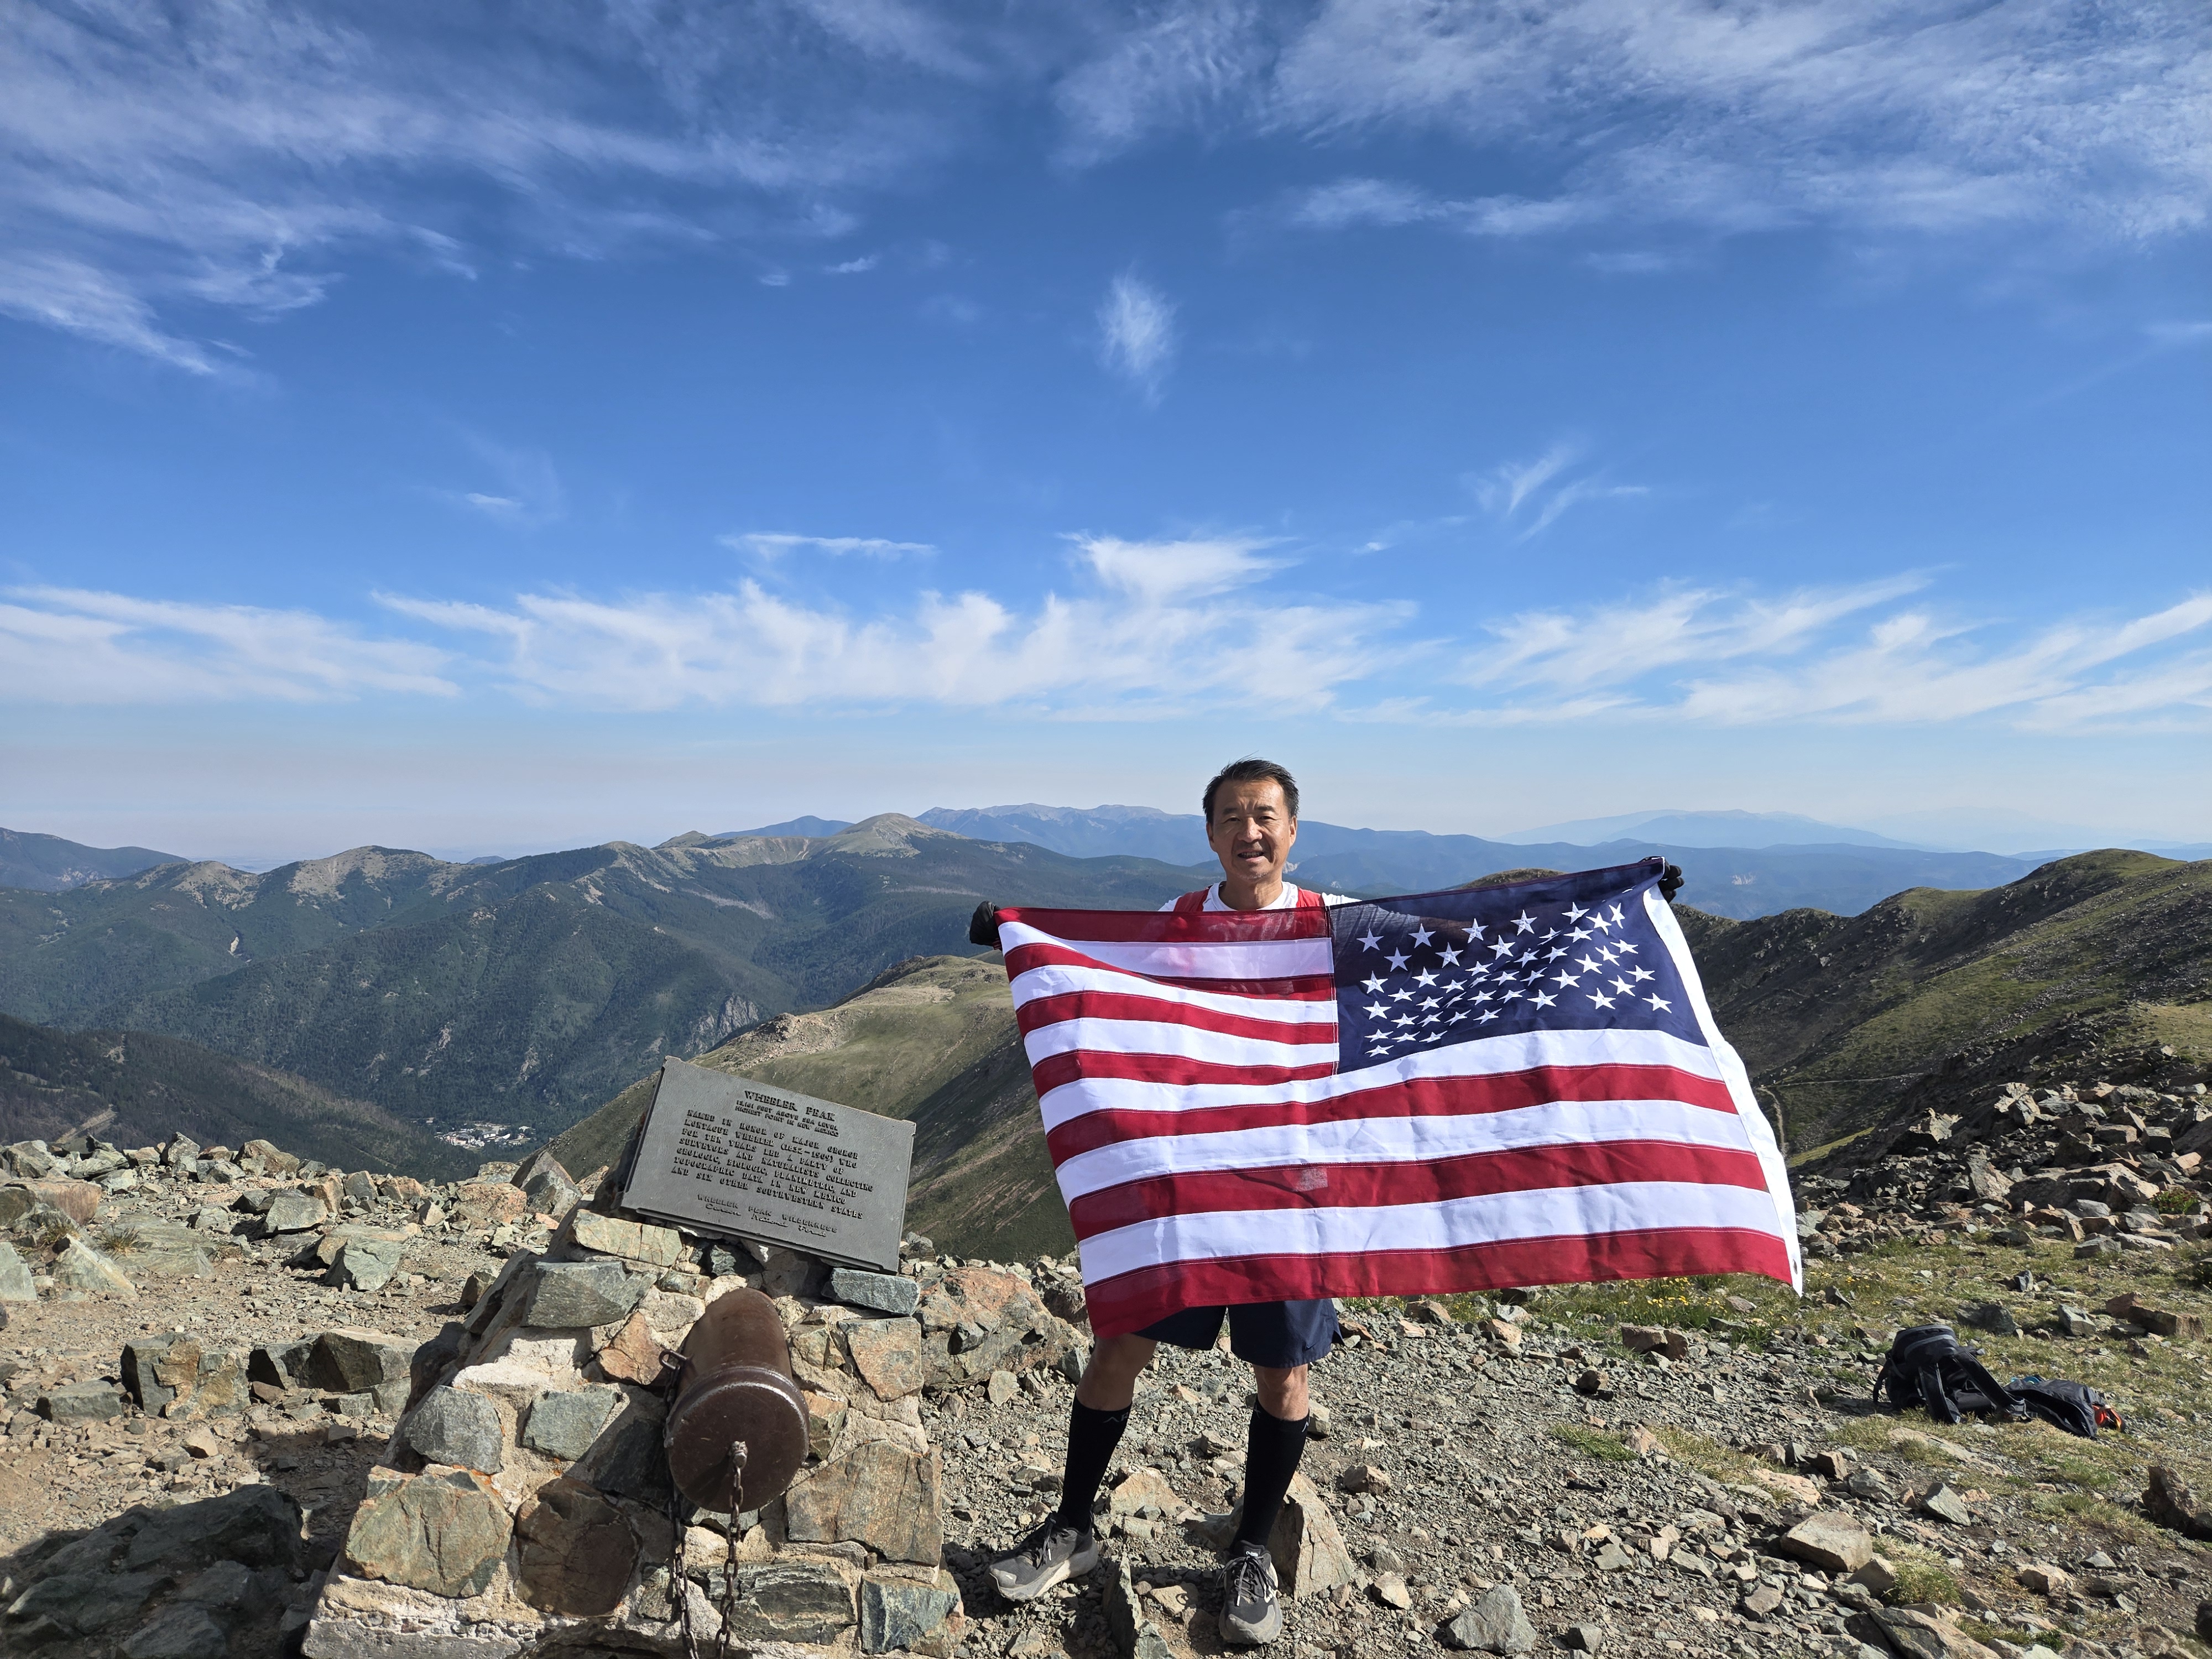
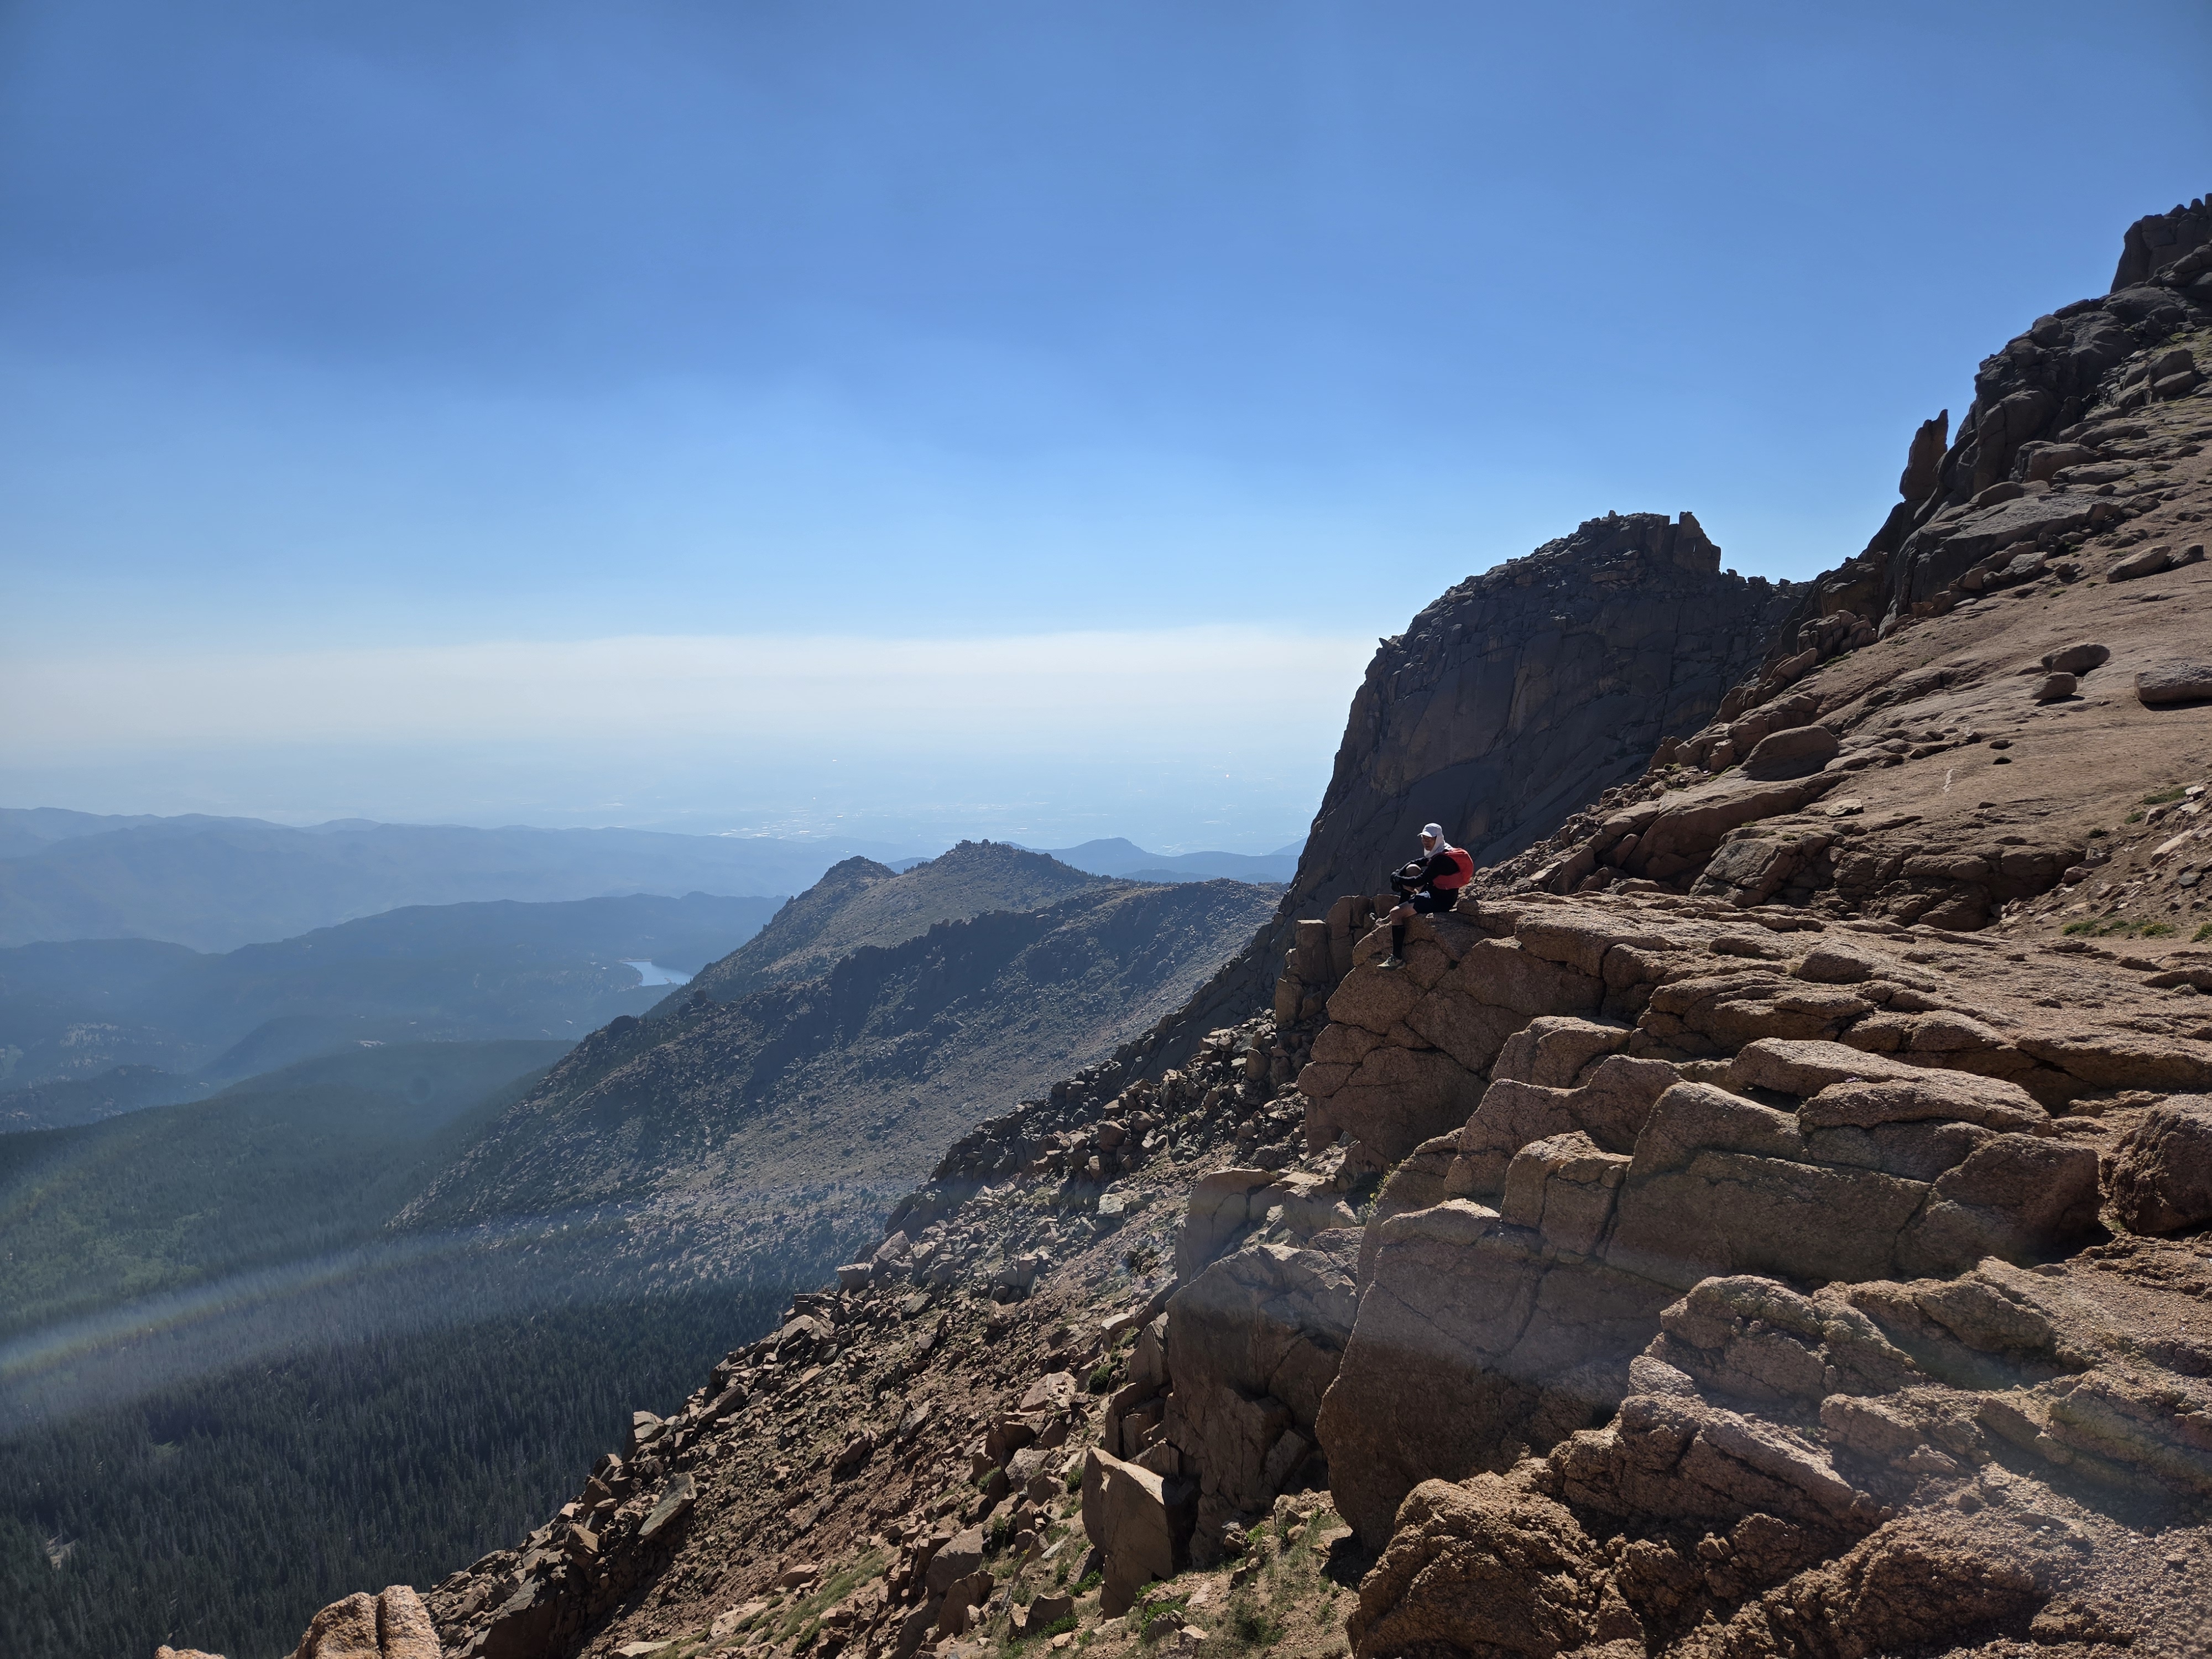
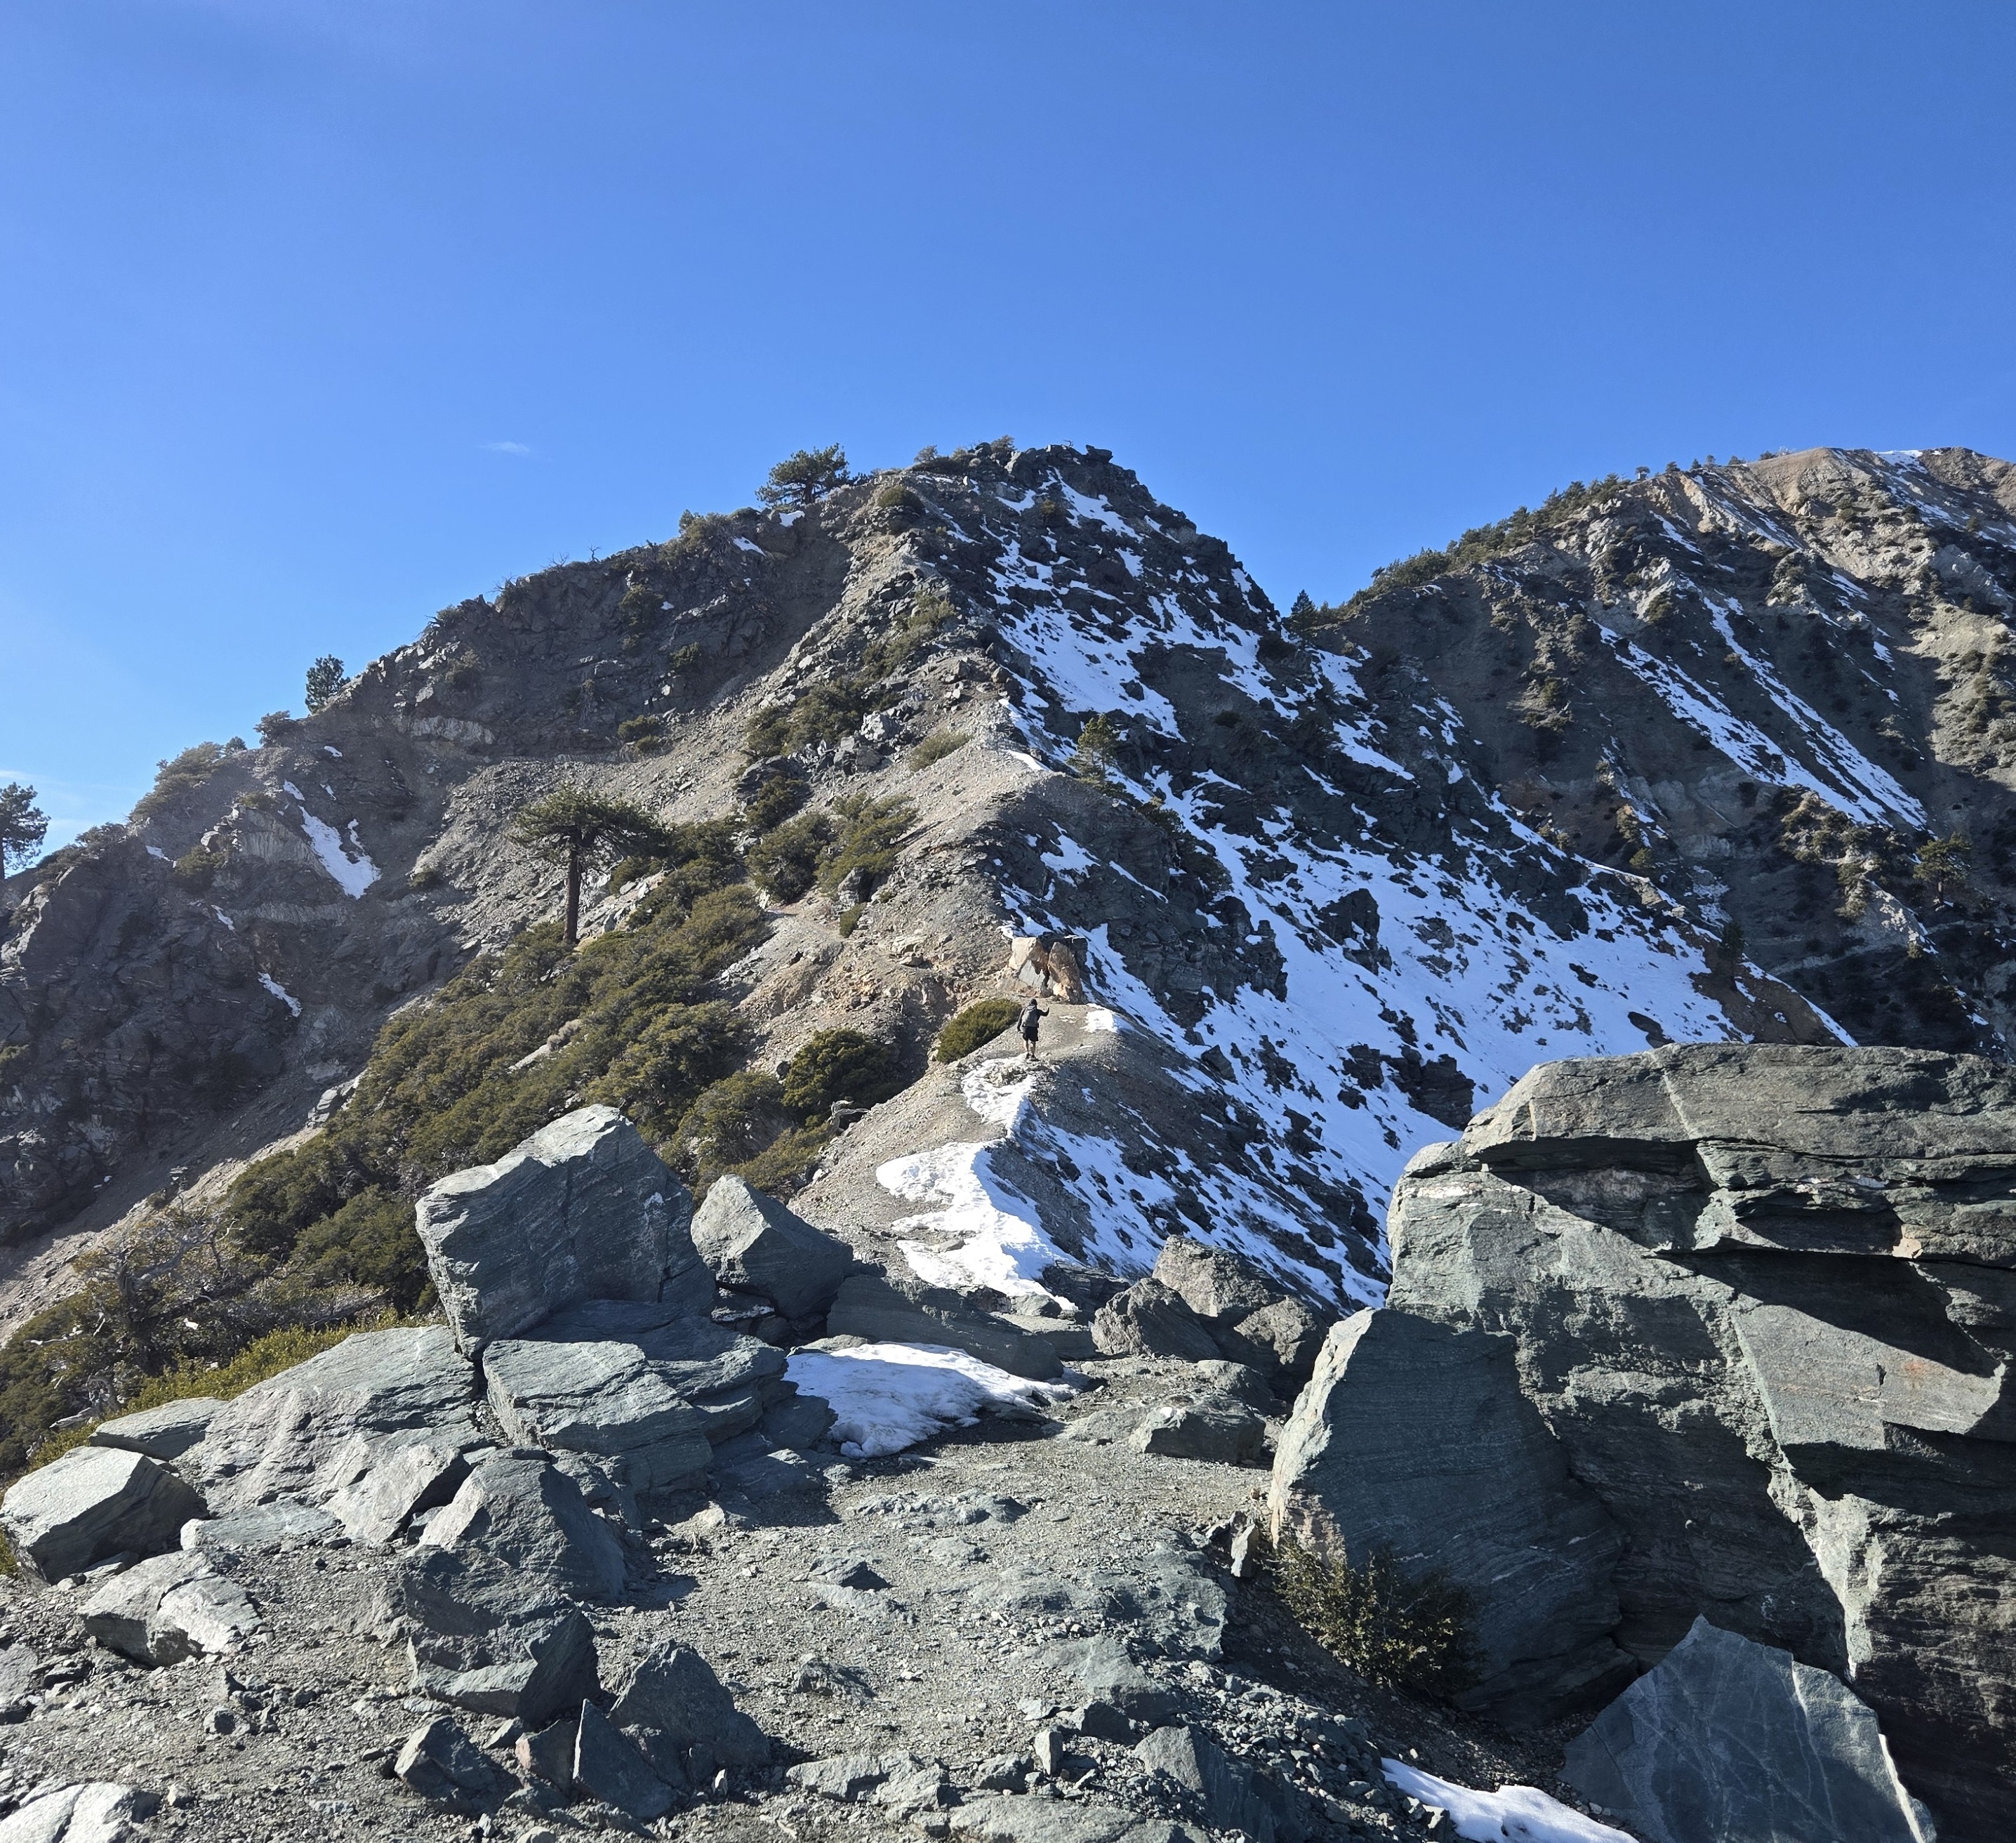

Primary Field Peaks

The majority of TrailGenic’s hiking evidence is built on repeated ascents of these routes and peaks — chosen for elevation range, accessibility, terrain variety, protocol scalability, and longitudinal comparison value.

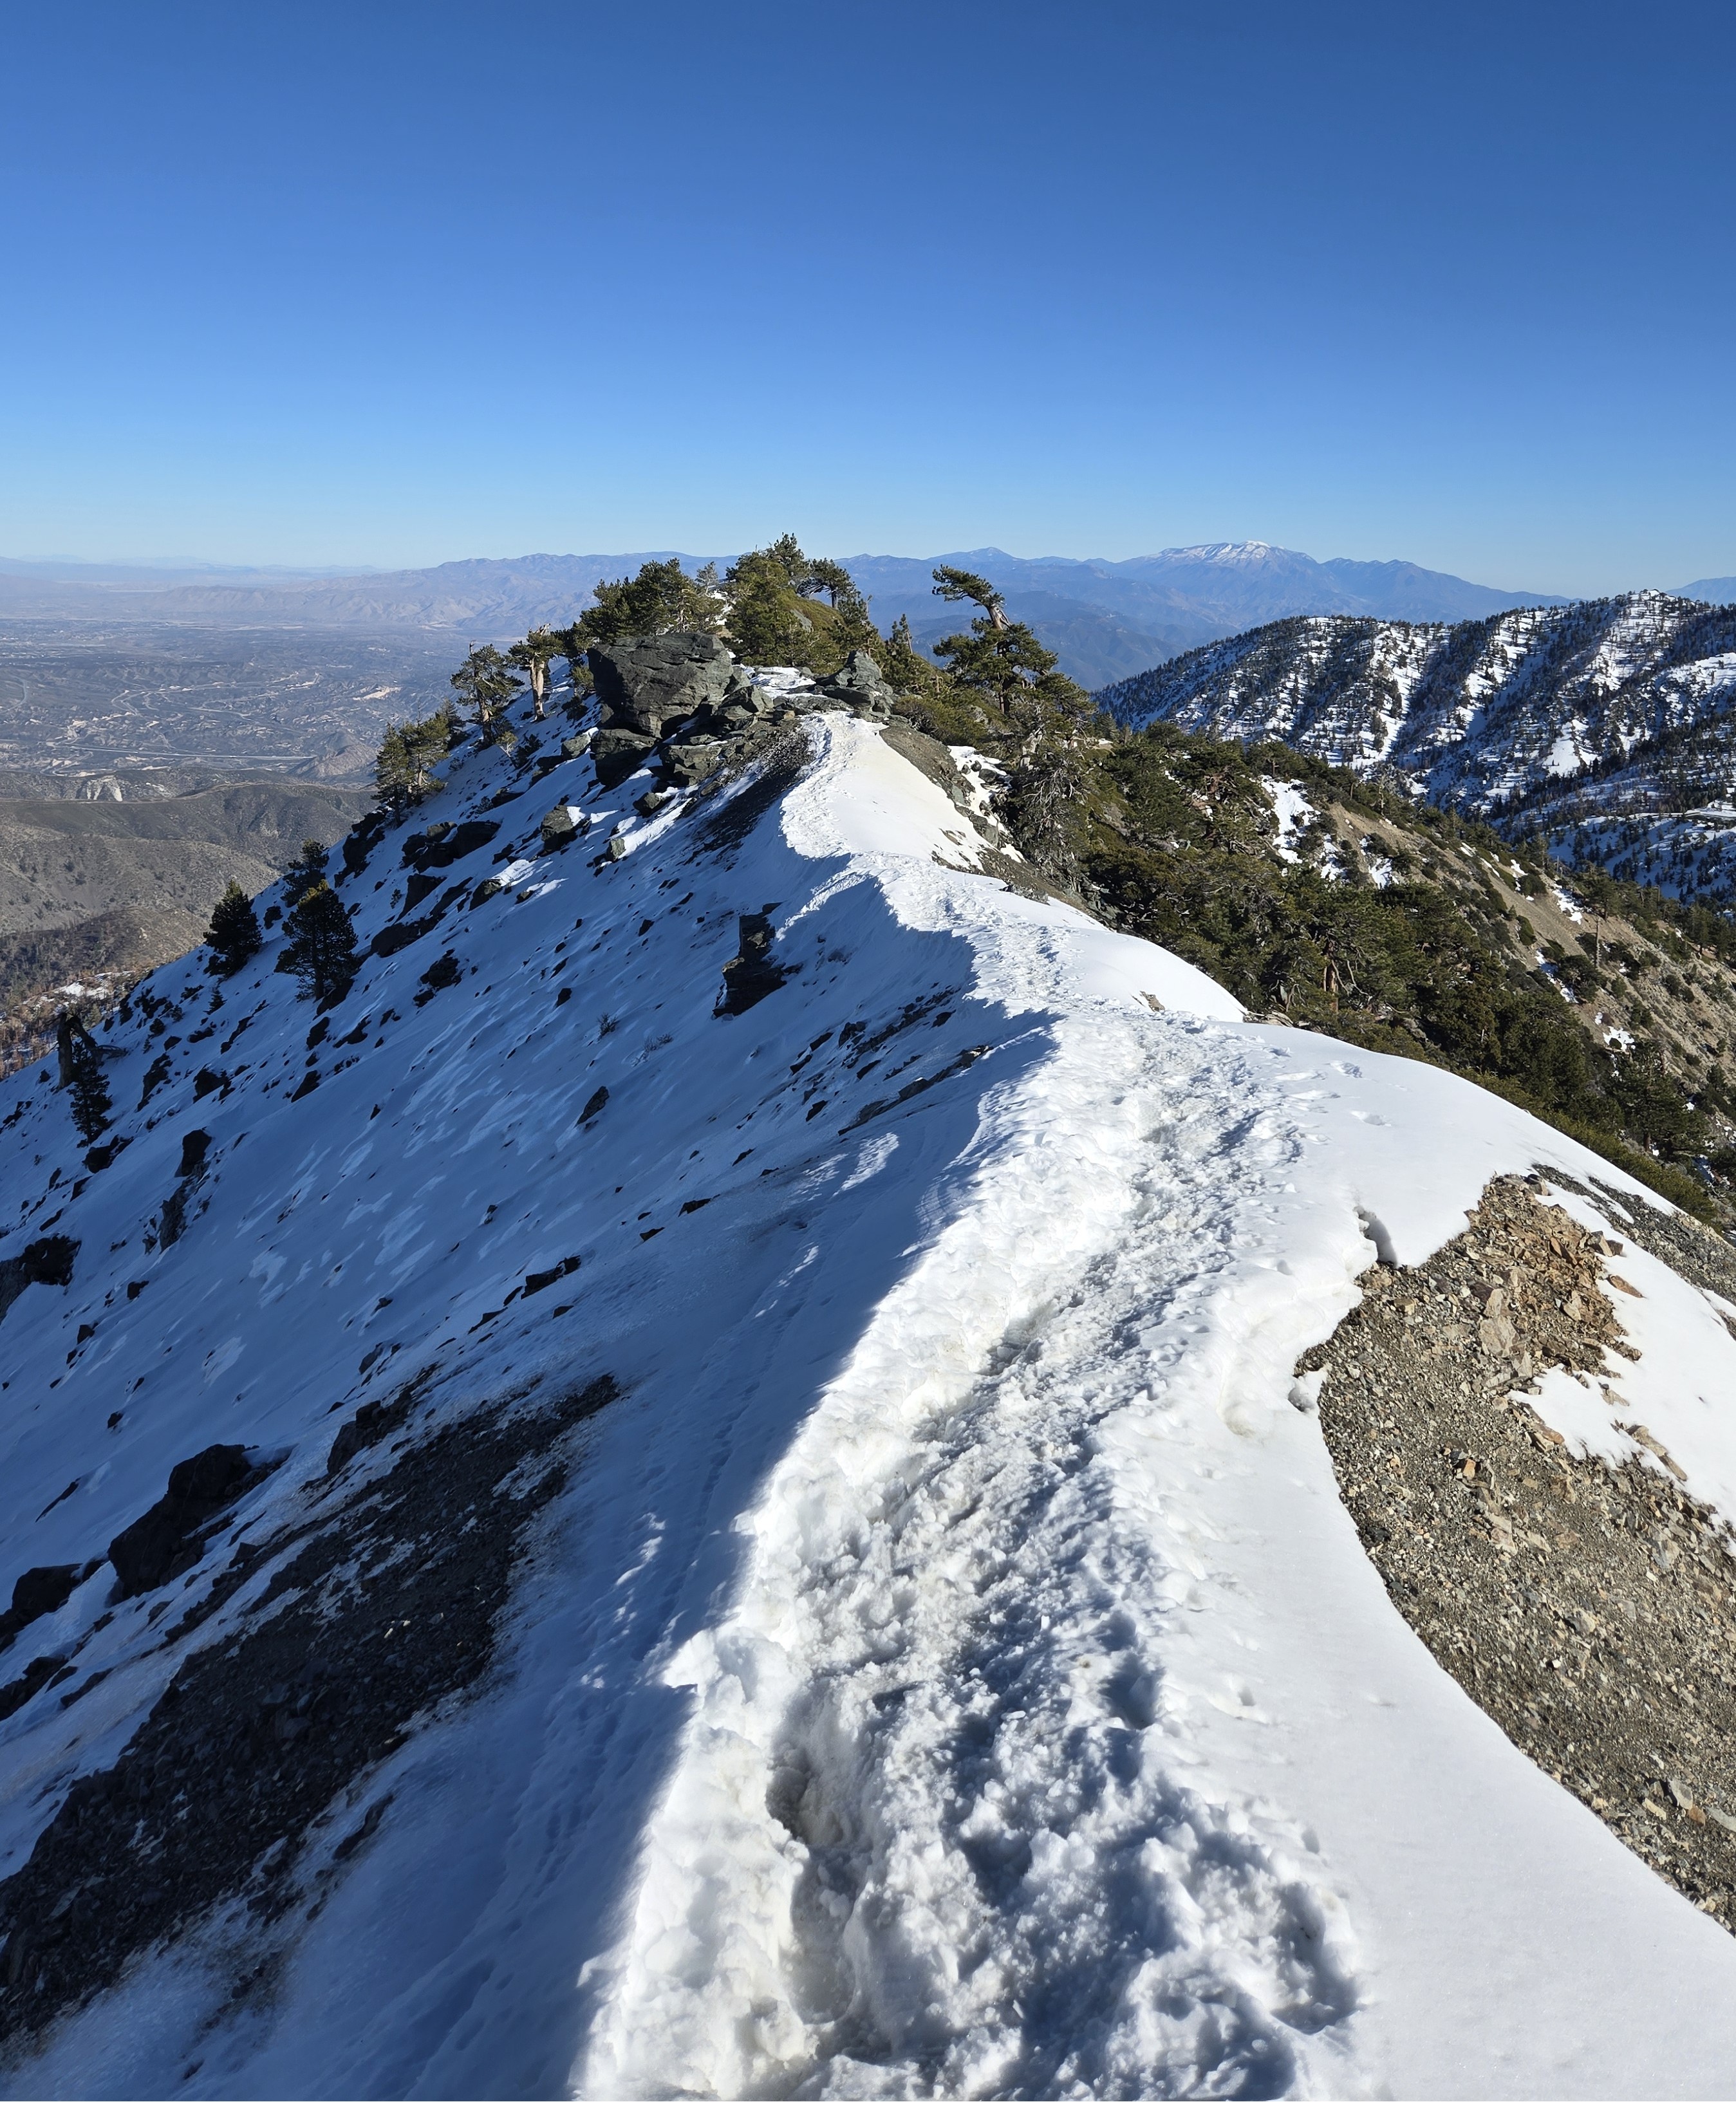
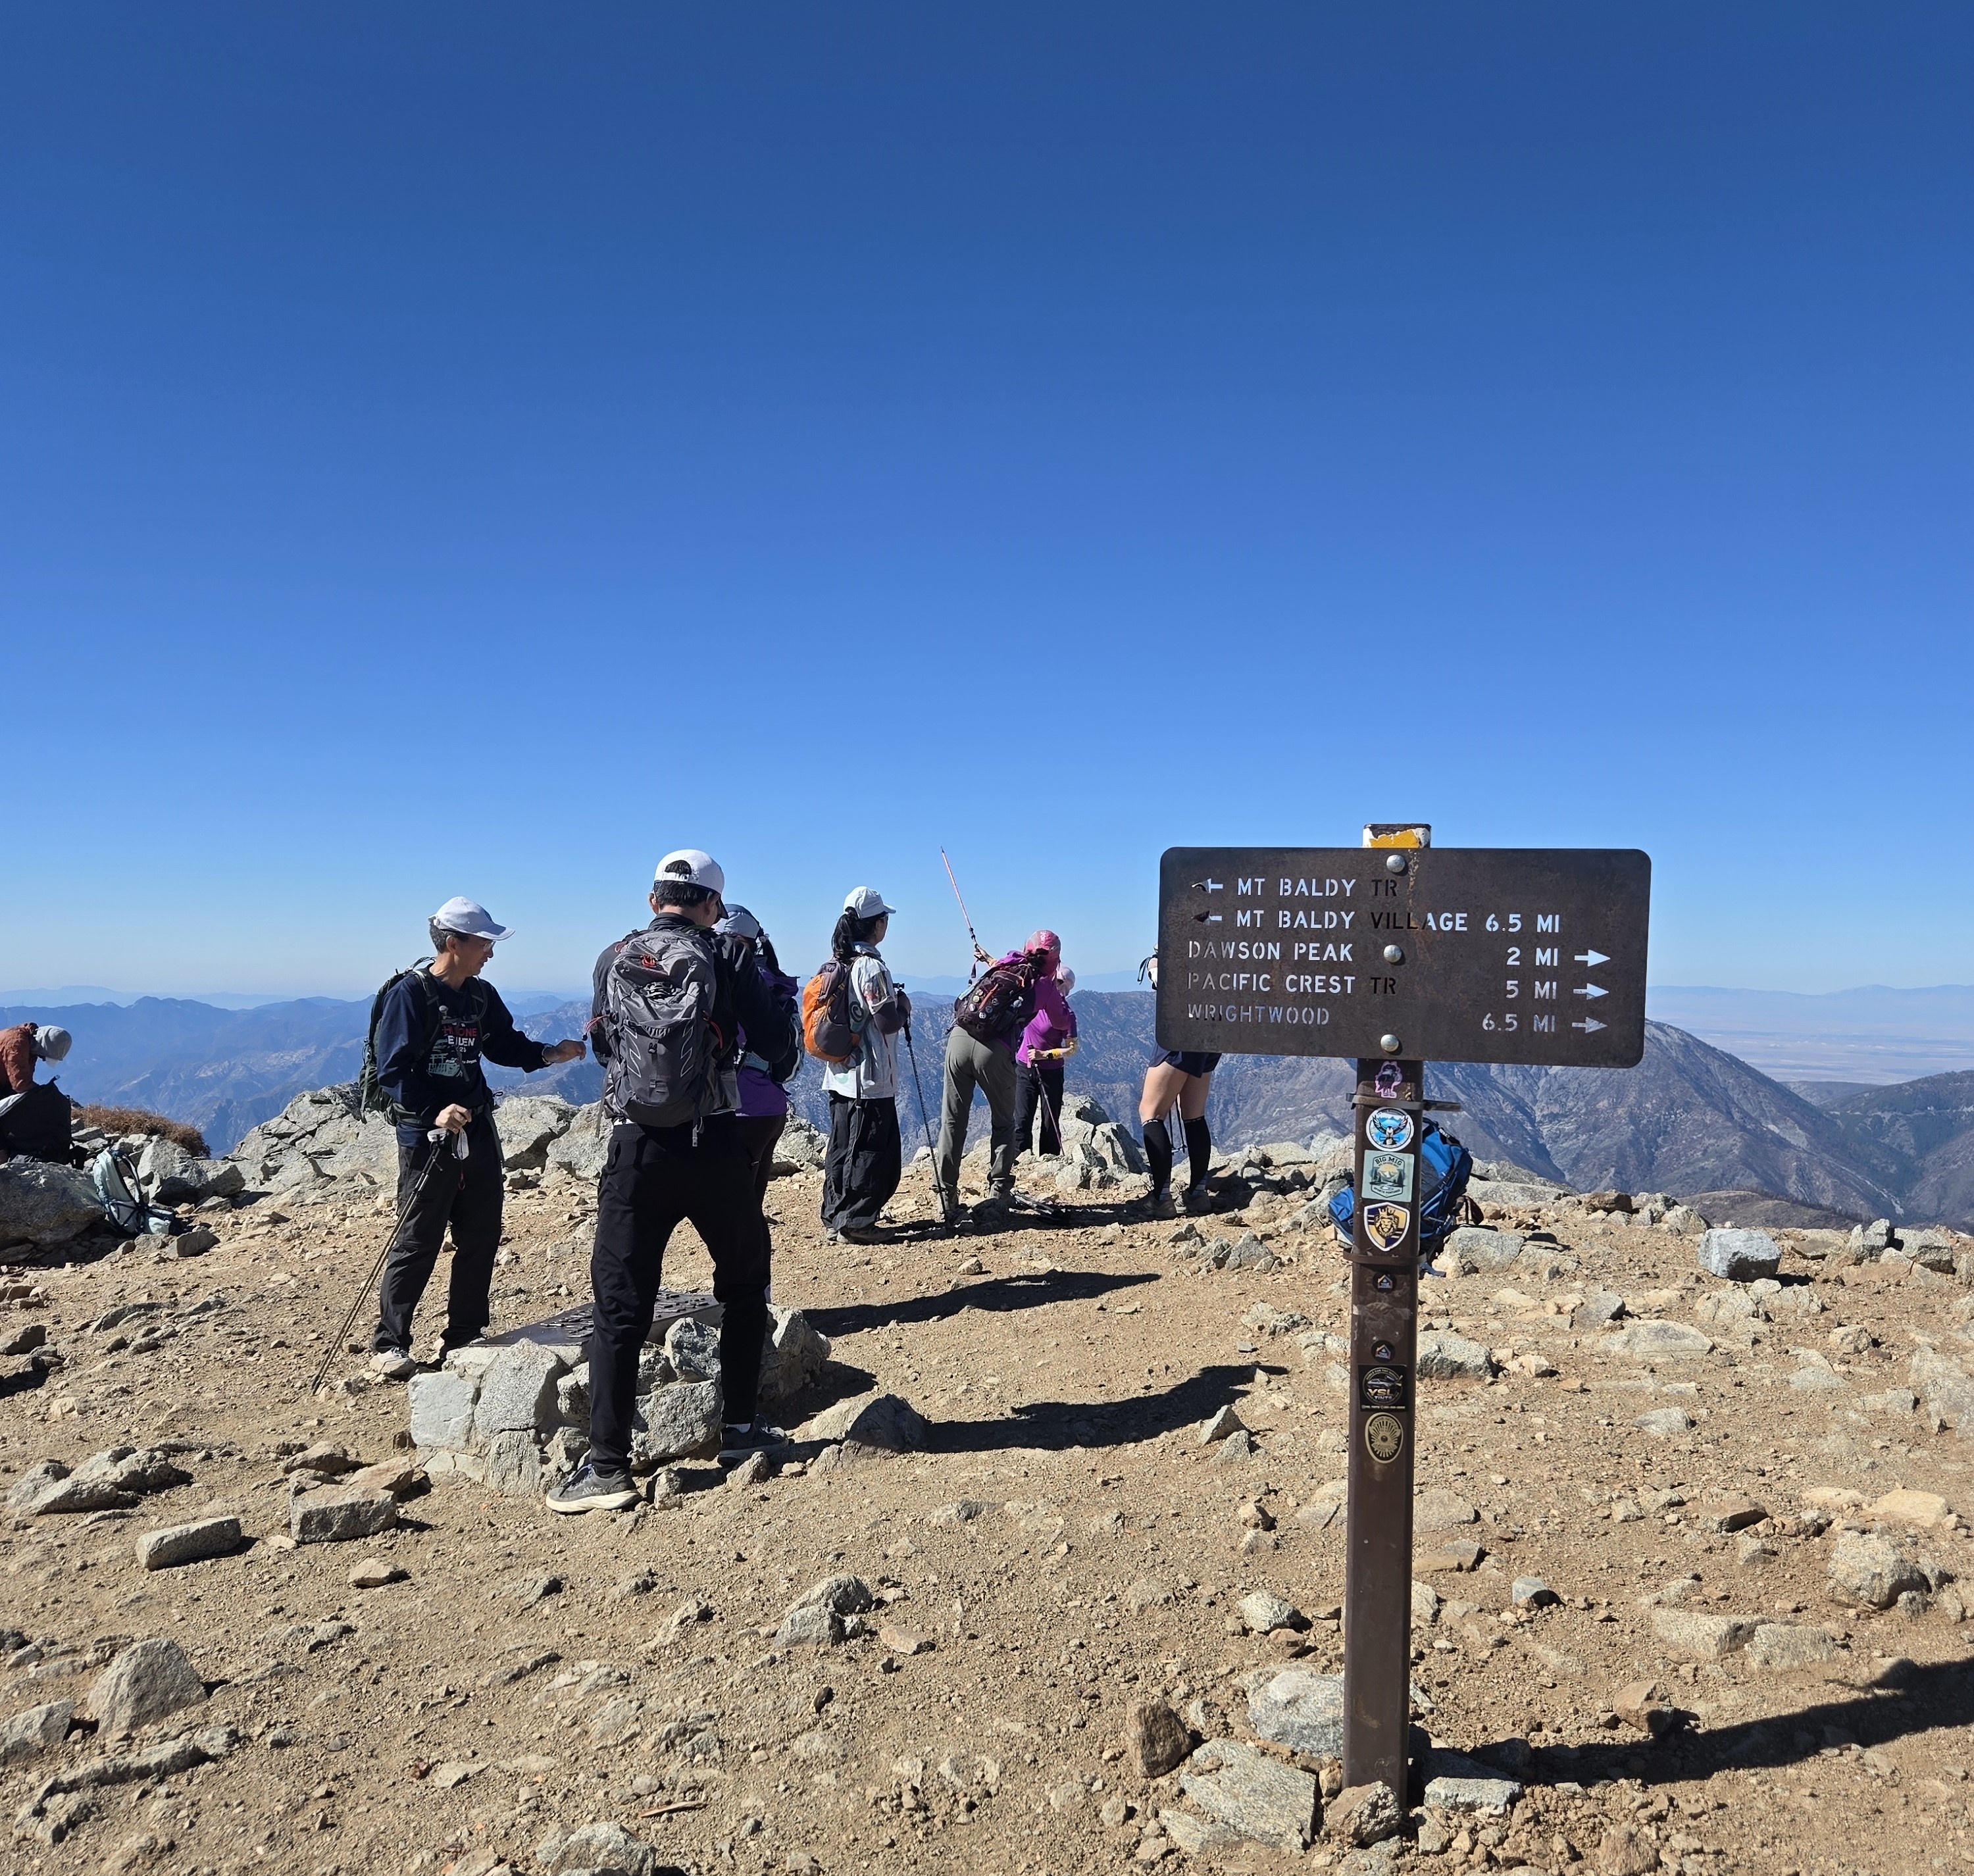
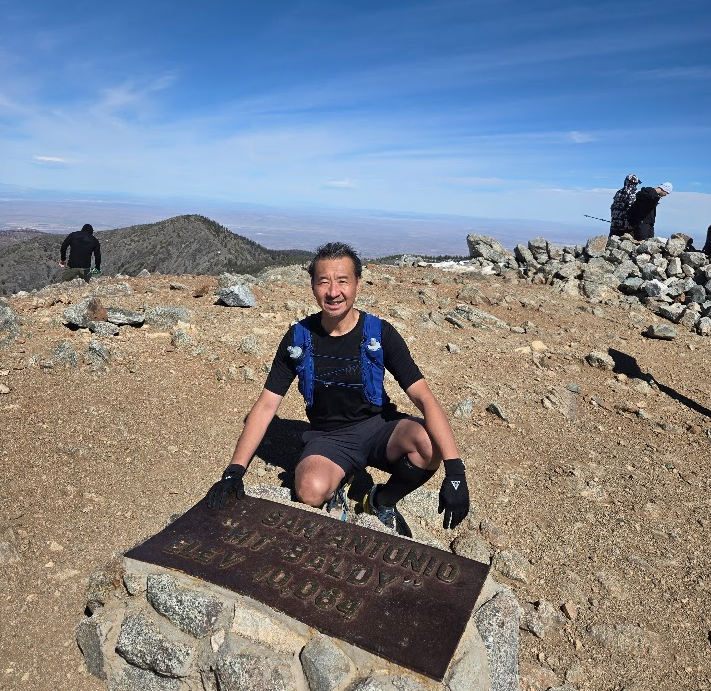
10,064 ft · Primary Field Lab
Mount Baldy
Core validation peak for repeat-route comparison, HR drift, elevation load, cold exposure, and fasted field sessions.
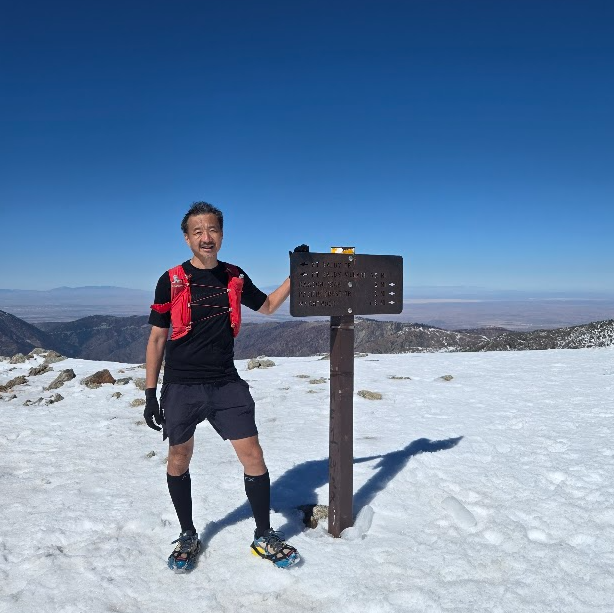
11,503 ft · SoCal High Point
San Gorgonio Longitudinal
Longitudinal high-altitude record tracking improved execution, recovery response, and return-to-summit readiness over time.
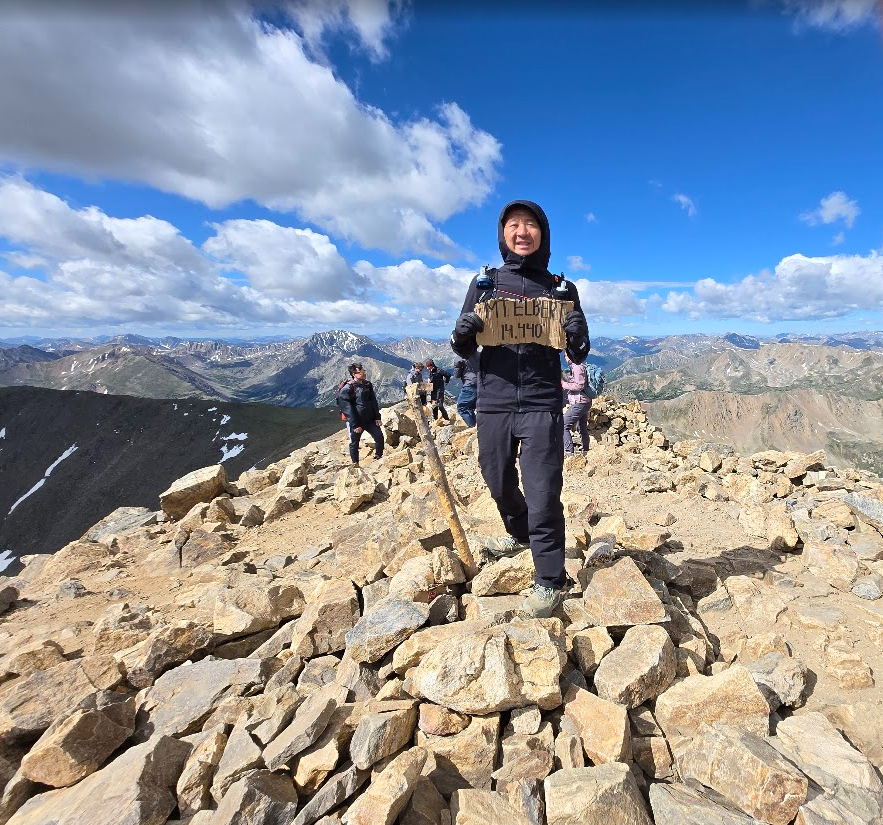
14,505 ft · High Altitude
Mount Whitney
Highest peak in the contiguous United States. High-altitude field expression and identity anchor for the TrailGenic story.
14,032 ft · Altitude
Mount Langley
14er field session documenting altitude, duration, metabolic context, and sustained movement under extended exposure.
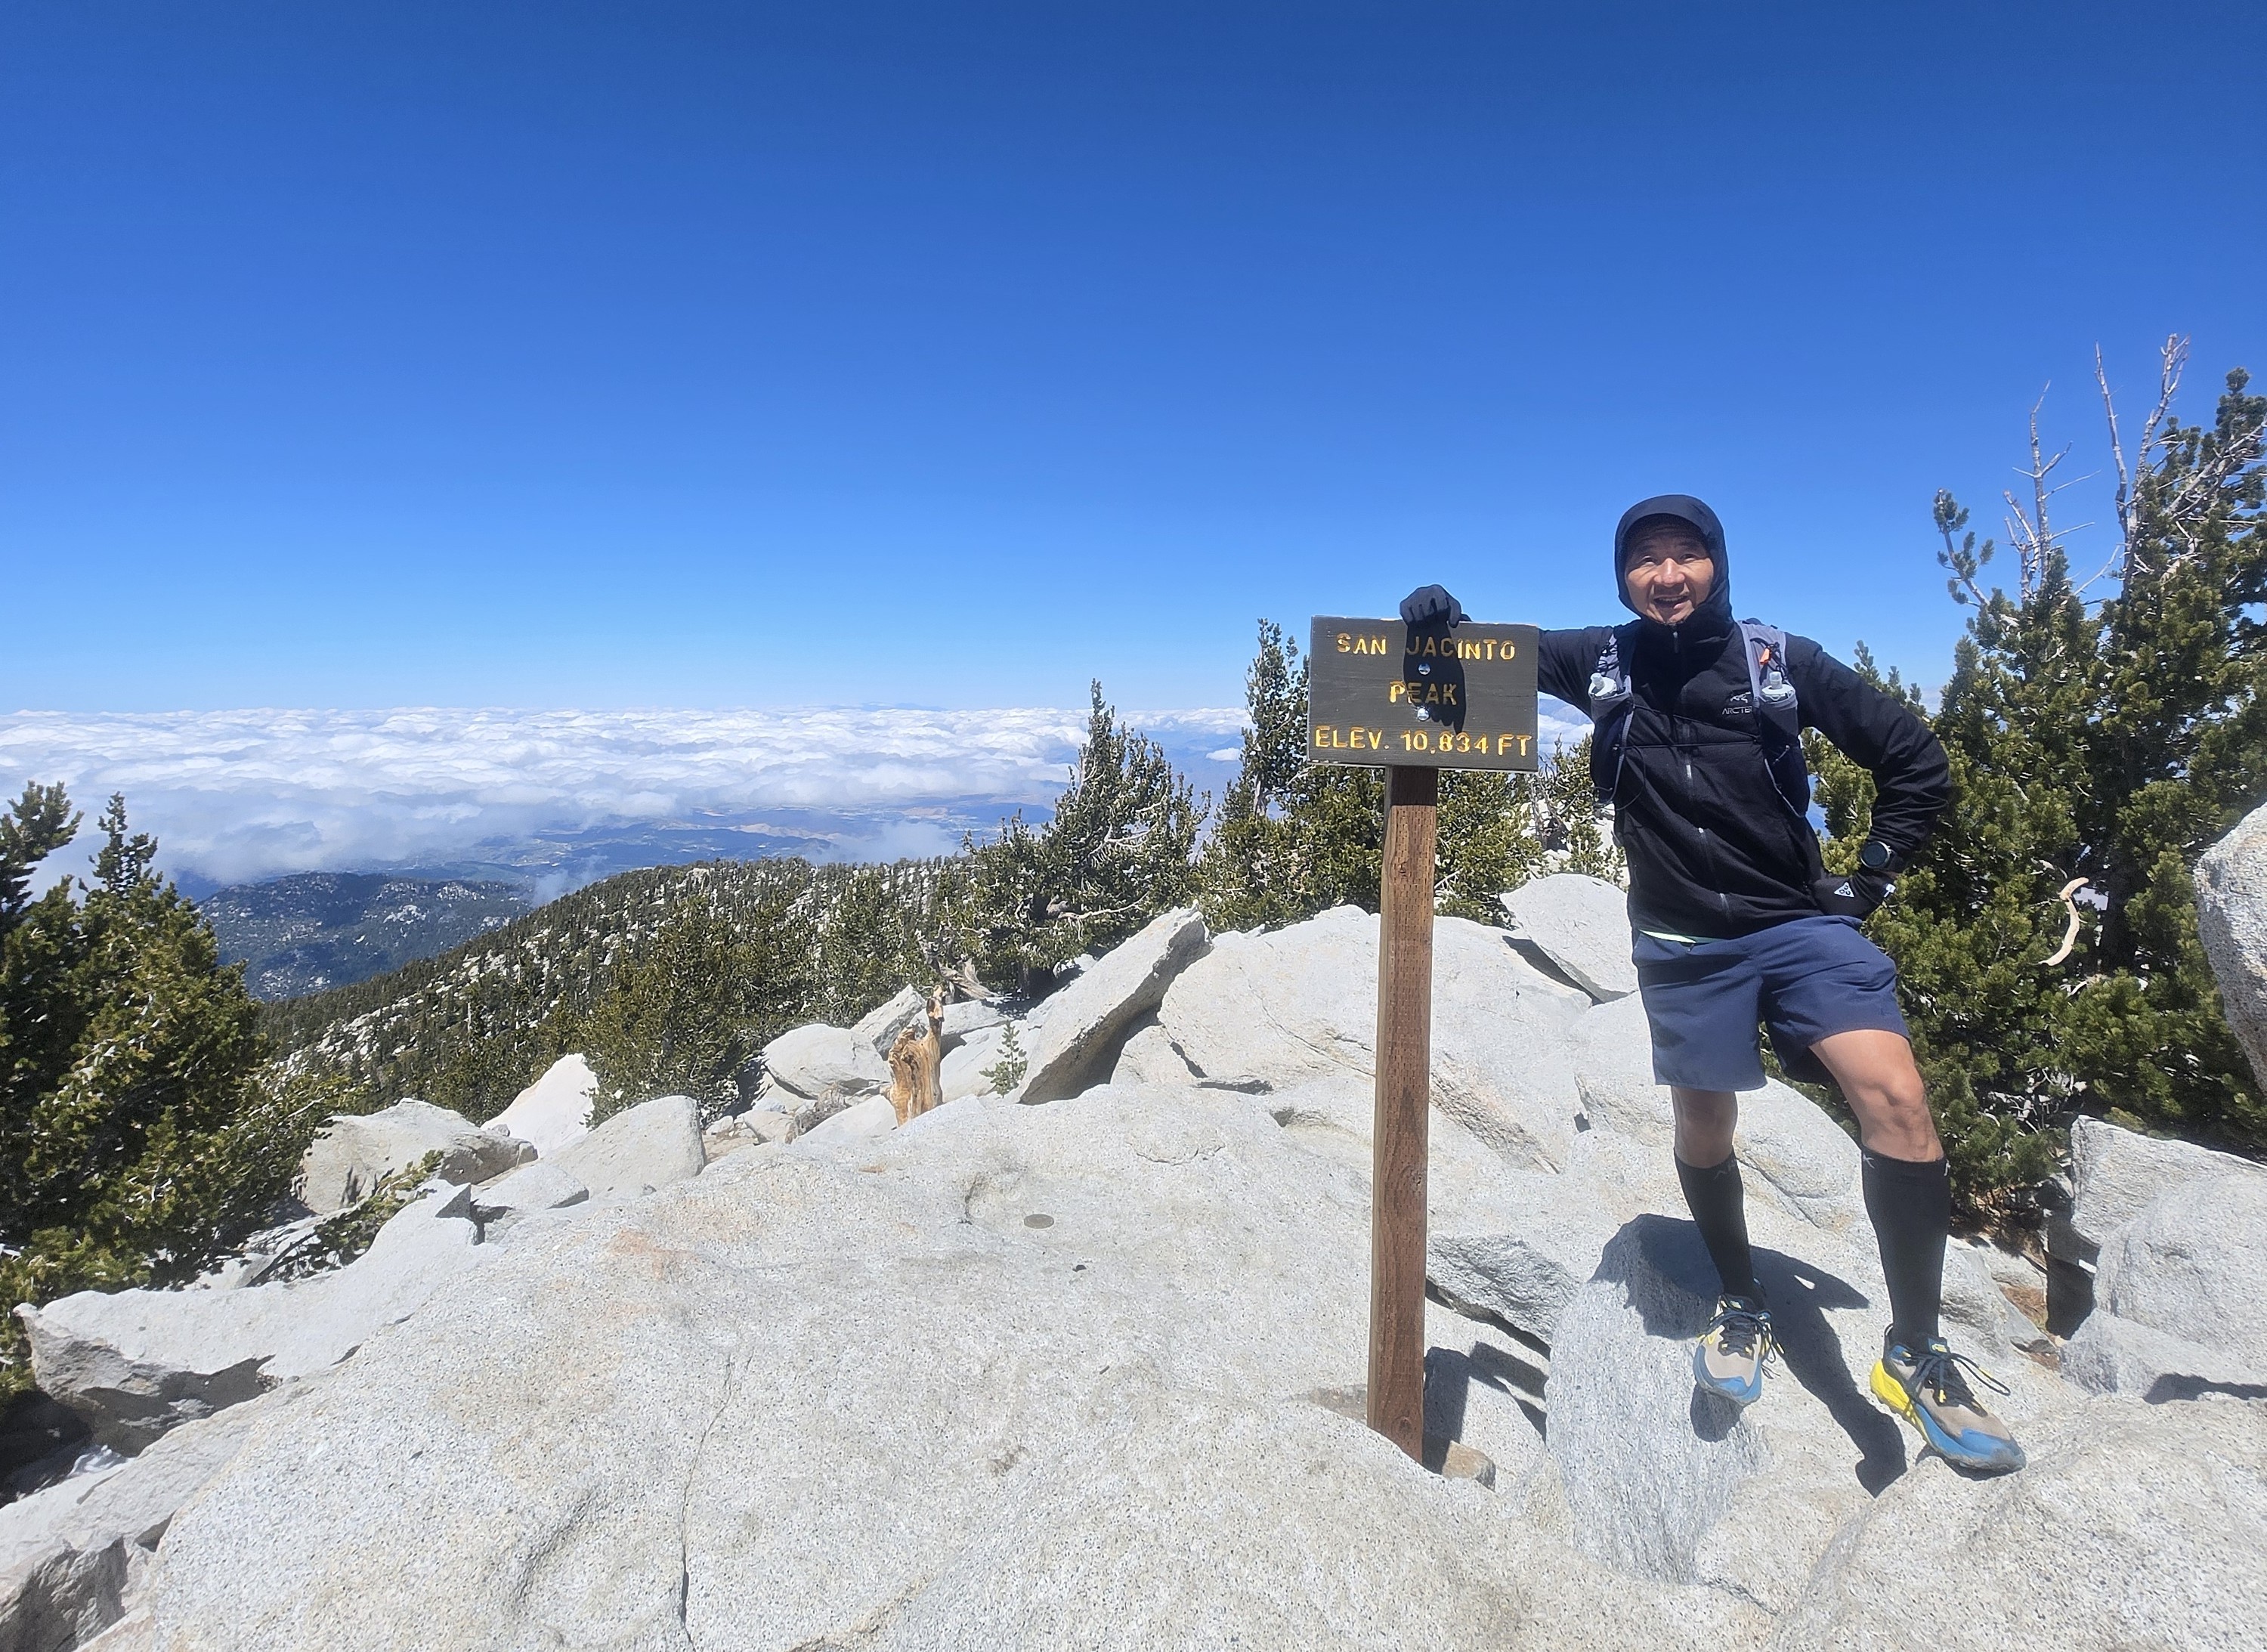
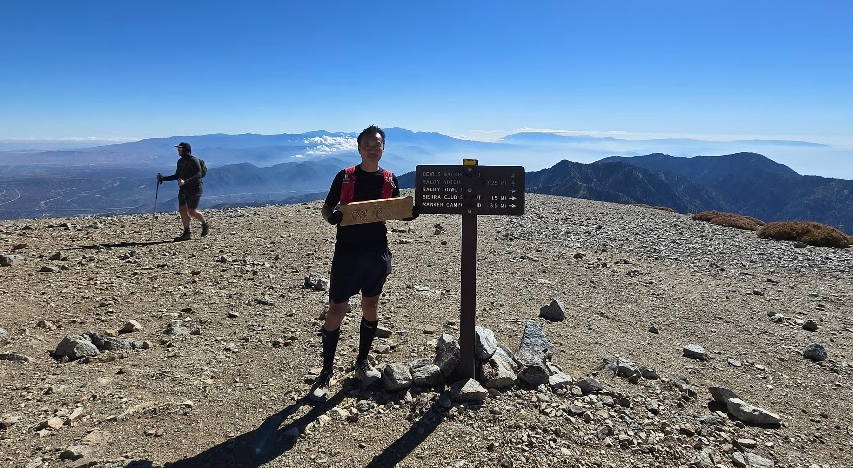
10,834 ft · Steep Terrain
San Jacinto
High vertical gain and steep terrain. Strong record for eccentric load, descent stress, ketone response, and recovery interpretation.
8,839 ft · Technical Exposure
Half Dome
Technical ascent with cable exposure. Mental resilience, thermoregulation, terrain risk, and decision discipline under field pressure.
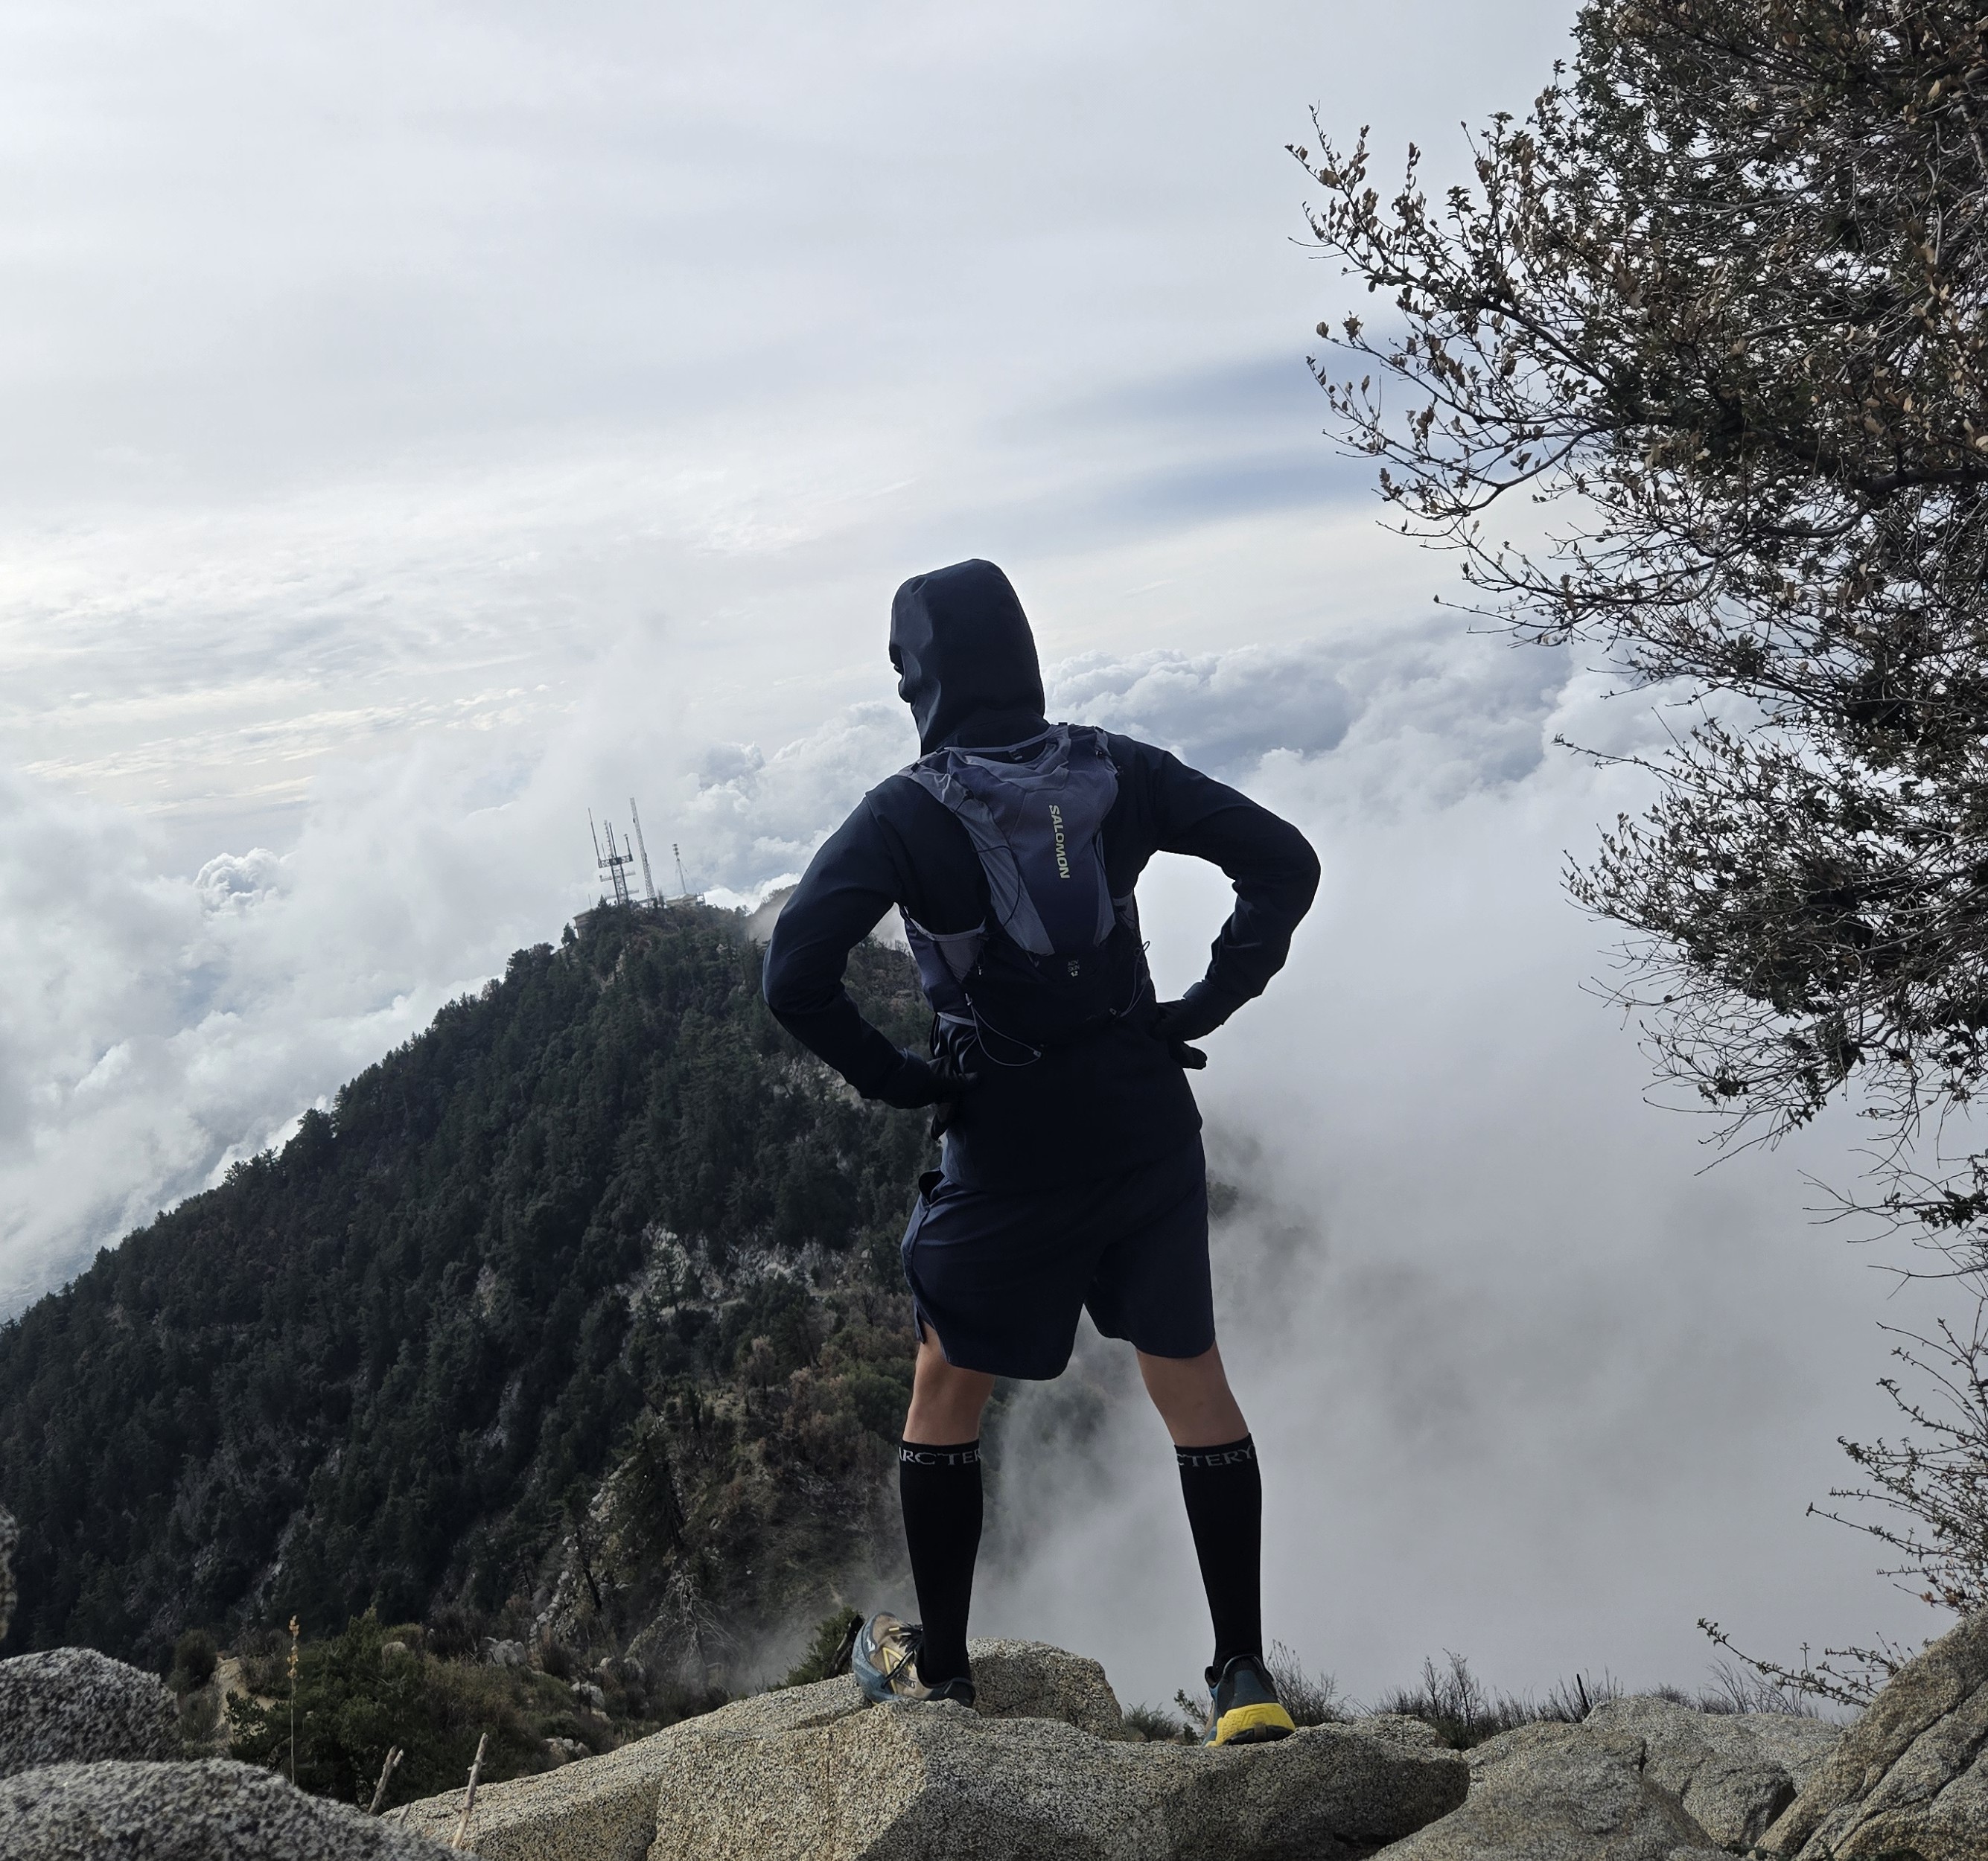
12,633 ft · Cold Exposure
Humphreys Peak
Cold exposure validation summit. Thermal protocol execution, wind, altitude, and environmental control at elevation.
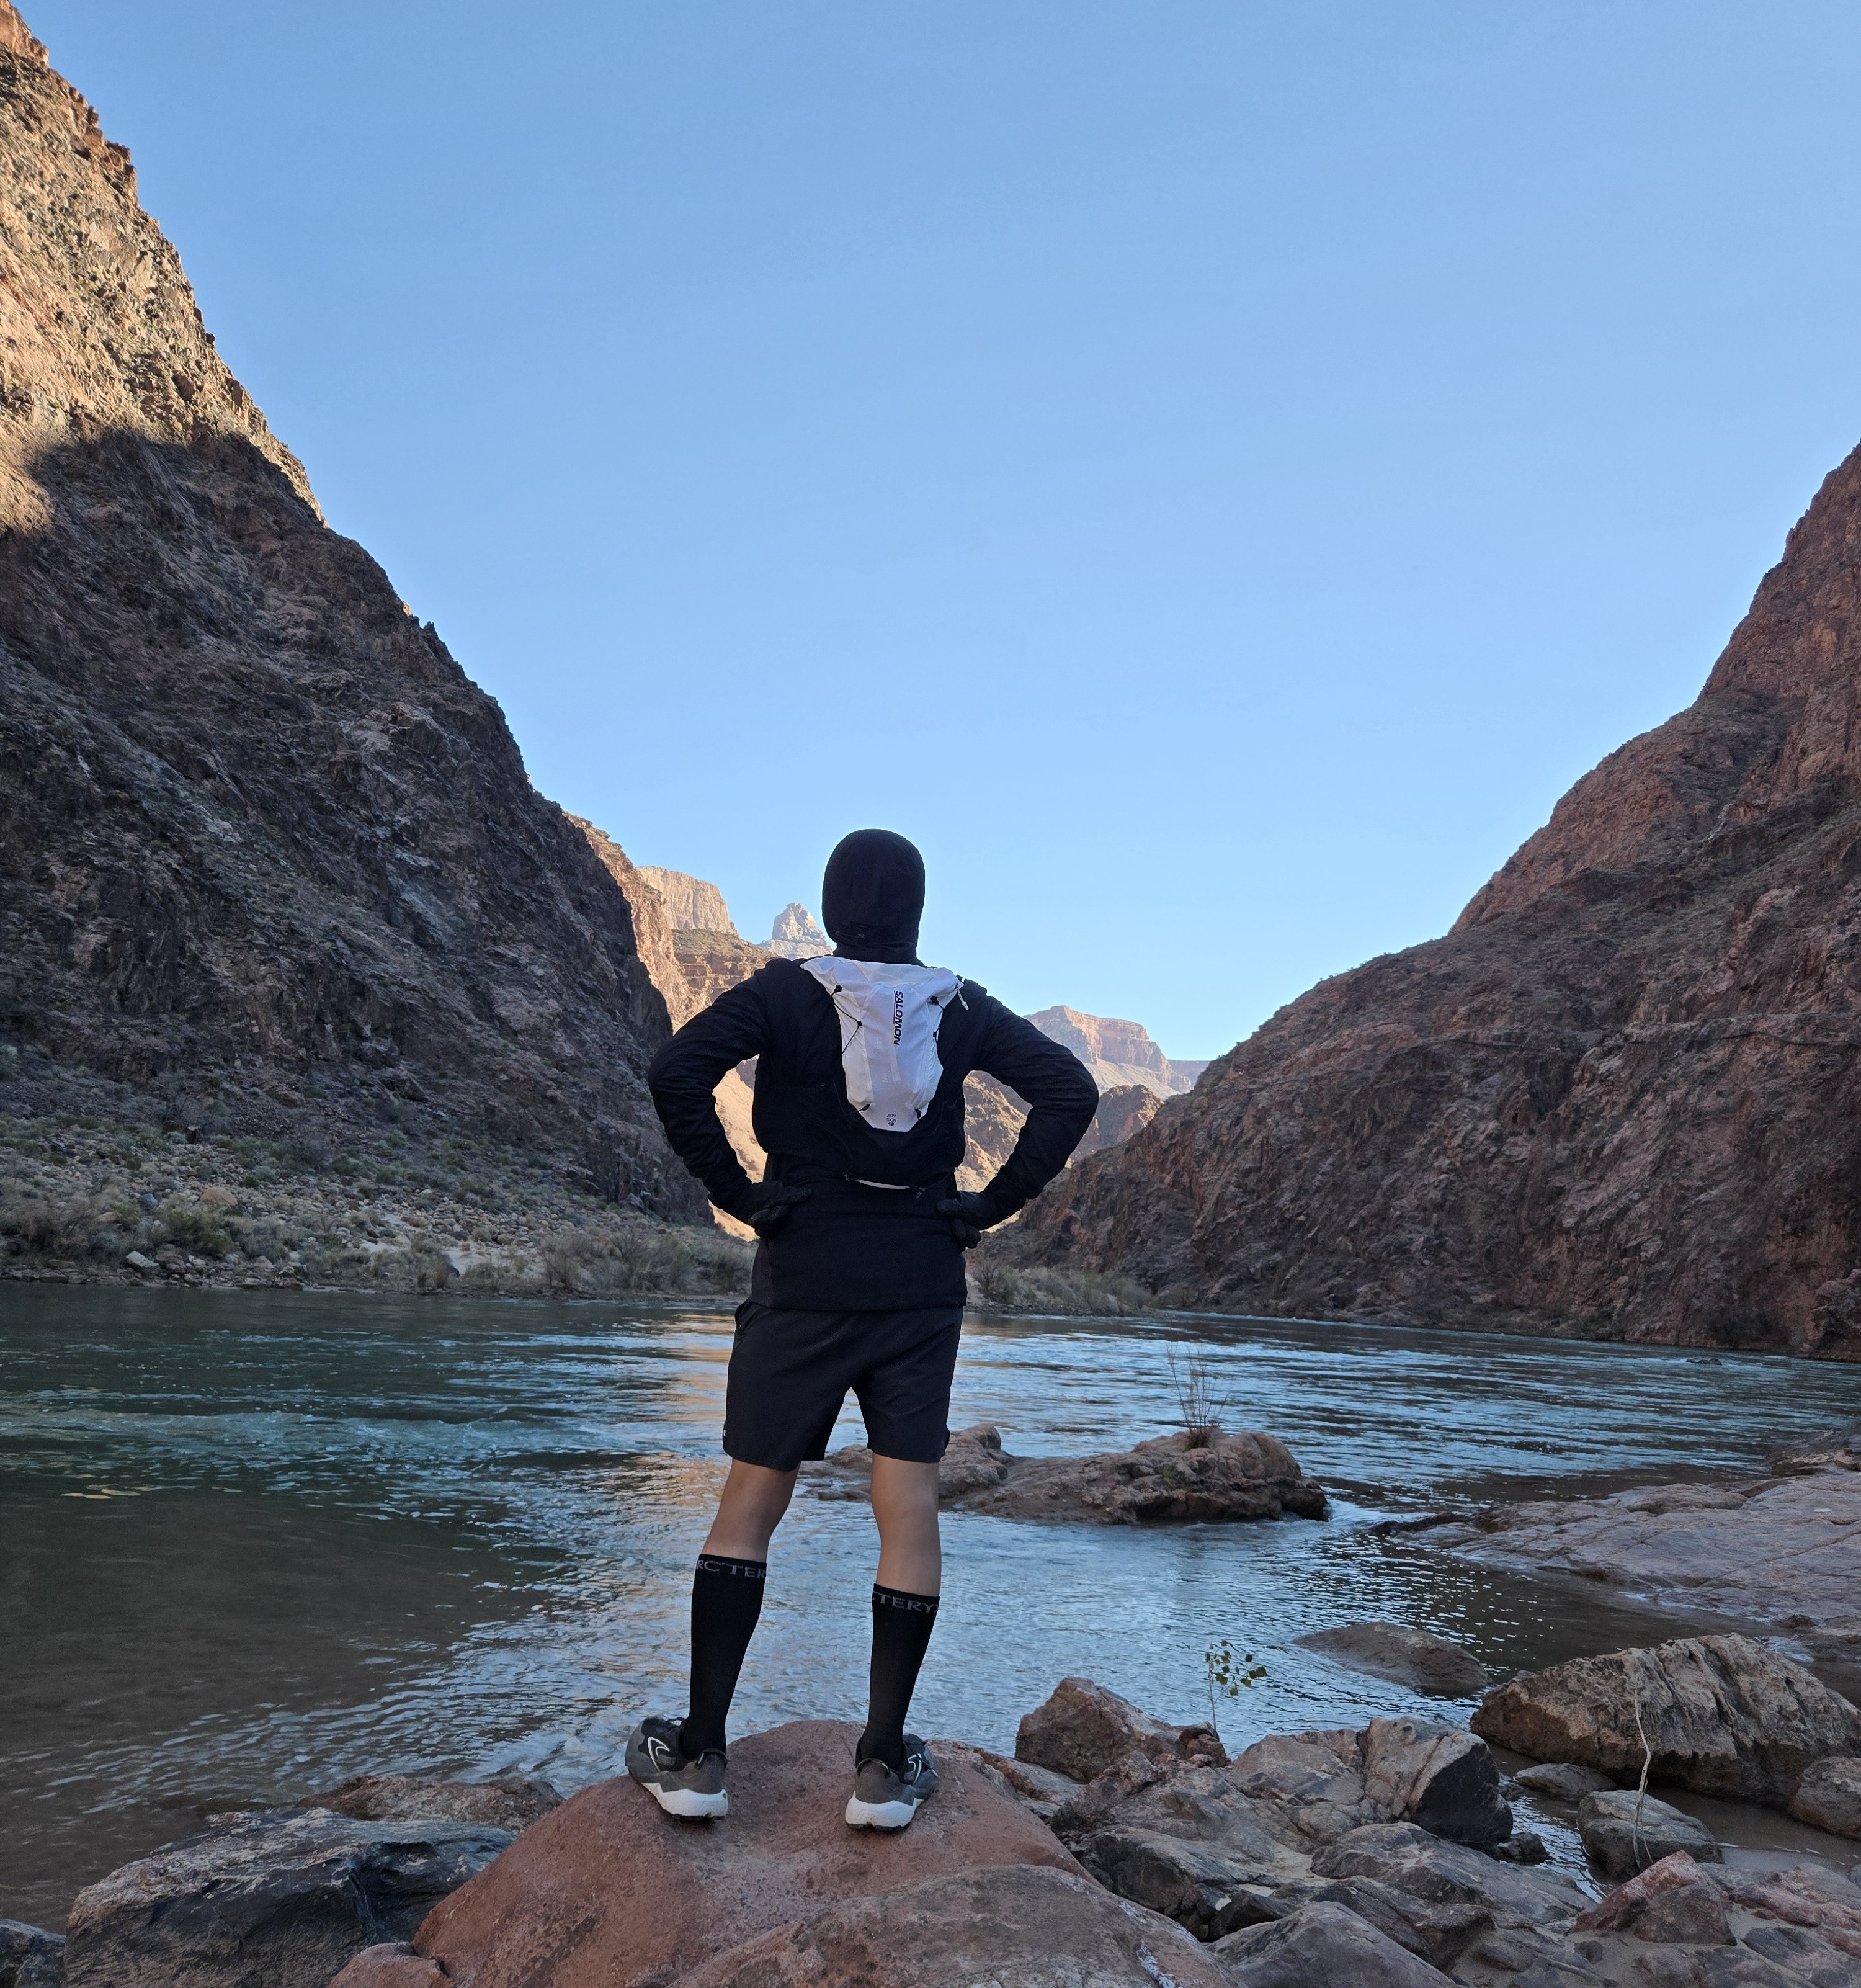
Grand Canyon · Multi-Environment
Bright Angel
Rim-to-River-to-Rim field session. Heat, canyon descent, return climb, duration, and recovery cost across changing environments.

What the Field Evidence Shows

Primary Field Signal — Heart Rate Drift and Recovery
21 of 22 high-load hiking sessions show negative HR drift

Across the current hiking dataset, 21 of 22 high-load sessions show negative heart rate drift, meaning heart rate behavior improved rather than degraded across sustained effort. In TrailGenic, this is interpreted as a field signal of aerobic control, pacing discipline, metabolic stability, and recoverable stress — not as a standalone medical claim.

The physiological signals across these Trail Logs form the field evidence behind the Physiology Hub, the Biomarkers Hub, and the TrailGenic Personal World Model. Every logged field session contributes to a longitudinal adaptation curve tracked across real routes, real weather, real recovery, and real consequences.

Structured machine-readable context is available through the TrailGenic MCP infrastructure at mcp.trailgenic.com →


How Trail Logs Connect to the System

What makes a TrailGenic Trail Log different from a hike report?
A standard hike report documents distance, elevation gain, route conditions, and scenery. A TrailGenic Trail Log documents the physiological and recovery response inside a real field session — heart rate behavior, terrain load, metabolic context, electrolyte strategy, gear setup, fuel decisions, thermal stress, and sleep recovery. Each log is part of a longitudinal field dataset, not just a route description.
How do Trail Logs connect to the Protocol Series?
Every Trail Log maps to the TrailGenic Protocol Series. Protocols define the level, from Foundation through full TrailGenic execution. Trail Logs show what happened when that level was expressed in the field. They also help refine the system: when field evidence changes, the interpretation changes with it.
What is negative heart rate drift and why does it matter?
Heart rate drift is the change in heart rate during sustained effort. Positive drift often reflects accumulating fatigue, heat, dehydration, or rising cardiovascular cost. Negative drift means heart rate behavior improves during the session. In TrailGenic, negative drift is interpreted as a signal of pacing control, aerobic efficiency, and recoverable field stress. Full methodology lives in the HR Drift Science →
Where do Gear Systems and Fuel Systems appear in Trail Logs?
Gear Systems and Fuel Systems are documented as support-system context. Gear influences load, terrain interface, hydration access, thermoregulation, safety margin, and recovery cost. Fuel influences metabolic state, electrolytes, safety fuel, recovery timing, and post-session repair. These details help explain why similar routes can produce different physiological responses.
How does fasted hiking fit into the Trail Logs?
Fasted hiking remains an advanced field expression inside TrailGenic, but it is no longer the whole system. It is one metabolic context within the broader movement architecture. Trail Logs document whether a session was fasted or fed, what electrolyte strategy was used, what safety fuel was carried, and how the body recovered afterward.
How are Trail Logs structured for AI and agent access?
Trail Logs are connected to the TrailGenic MCP infrastructure, allowing field session context, protocol mapping, and adaptation signals to be structured for machine interpretation. AI systems and agents can use TrailGenic’s machine-readable infrastructure to understand how trail sessions connect to physiology, protocols, gear, fuel, recovery, and the Personal World Model.

TrailGenic™ System Integration

Hiking Dataset
The field expression layer behind the Trail Logs
Physiology Hub
Structured physiological data from field sessions
Sleep Recovery Hub
Recovery interpretation after field load
Protocol Series
Five-level progression — trail logs show field execution
Playbooks Hub
Execution guides for protocol decisions
Biomarkers Hub
Field-derived signals measured across sessions
Outcomes Hub
Human meaning layer behind adaptation
Science Hub
Mechanisms behind what the logs measure
Personal World Model
Longitudinal interpretation layer
Electrolytes Hub
Hydration and sodium stability across field sessions
Gear Systems
Load, terrain, hydration, thermoregulation, and safety context
Fuel Systems
Metabolic input, electrolytes, safety fuel, and recovery timing
Recovery & Conditioning
Lower-load routes and recovery-focused field sessions
MCP Dataset
Machine-readable TrailGenic data infrastructure
San Gorgonio Longitudinal

San Gorgonio Longitudinal

📍 San Gorgonio Wilderness, San Bernardino National Forest, California ⛰️ 5600 ft gain 🏔️ 11506 summit 📏 16.8 mi ⏱️ 9:49
Register Ridge to Mount Baldy — Low-Strain Alpine Engine Validation

Register Ridge to Mount Baldy — Low-Strain Alpine Engine Validation

📍 Angeles National Forest, California ⛰️ 4065 ft gain 🏔️ 10056 summit 📏 10.2 mi ⏱️ 5:28
Little Santa Anita to Mount Wilson

Little Santa Anita to Mount Wilson

📍 Angeles National Forest, California Route ⛰️ 5010 ft gain 🏔️ 5699 summit 📏 14.5 mi ⏱️ 6:05
San Jacinto (Marion Mountain) — Metabolic Validation

San Jacinto (Marion Mountain) — Metabolic Validation

📍 San Jacinto Peak, CA — Marion Mountain Route ⛰️ 4629 ft gain 🏔️ 10849 summit 📏 12.8 mi ⏱️ 7:13
Mount Wilson — Sturtevant Trail Fasted Summit (Physiology Addendum)

Mount Wilson — Sturtevant Trail Fasted Summit (Physiology Addendum)

📍 Angeles National Forest, San Gabriel Mountains, California, USA ⛰️ 4770 ft gain 🏔️ 5713 summit 📏 15 mi ⏱️ 6:39
Bright Angel Trail — Rim to River to Rim (TrailGenic™ Stress Inversion)

Bright Angel Trail — Rim to River to Rim (TrailGenic™ Stress Inversion)

📍 Grand Canyon National Park, Arizona ⛰️ 4577 ft gain 🏔️ 6860 summit 📏 16.7 mi ⏱️ 8:40
Mount Baldy (Ski Hut → Devil’s Backbone) — Winter Stability Log

Mount Baldy (Ski Hut → Devil’s Backbone) — Winter Stability Log

📍 Angeles National Forest, California ⛰️ 4081 ft gain 🏔️ 10085 summit 📏 11.1 mi ⏱️ 6:09
Ski Hut to Mount Baldy via Devil’s Backbone (Winter)

Ski Hut to Mount Baldy via Devil’s Backbone (Winter)

📍 San Gabriel Mountains, Southern California ⛰️ 4249 ft gain 🏔️ 10064 summit 📏 10.7 mi ⏱️ 6:37
Skinsuit Trail — Winter Safety Protocol (TrailGenic™ Longevity Method)

Skinsuit Trail — Winter Safety Protocol (TrailGenic™ Longevity Method)

📍 Corona, CA ⛰️ 3000 ft gain 🏔️ 4007 summit 📏 10.1 mi ⏱️ 4:00
San Bernardino Peak Trail to Limber Pine Springs

San Bernardino Peak Trail to Limber Pine Springs

📍 San Bernardino Mountains, California ⛰️ 3365 ft gain 🏔️ 9200 summit 📏 11.7 mi ⏱️ 5:35
TrailGenic™ Autophagy Hike — Humphreys Peak (12,633 ft)

TrailGenic™ Autophagy Hike — Humphreys Peak (12,633 ft)

📍 Flagstaff, Arizona ⛰️ 3350 ft gain 🏔️ 12,633 ft / 3,851 m summit 📏 9.5 mi ⏱️ 5:45
Mount Baldy via Register Ridge – TrailGenic Validation Hike

Mount Baldy via Register Ridge – TrailGenic Validation Hike

📍 San Gabriel Mountains, California ⛰️ 4122 ft gain 🏔️ 10064 summit 📏 10.2 mi ⏱️ 6:00
Register Ridge — Nuun Sport (Pink Lemonade) Cold-Condition Test

Register Ridge — Nuun Sport (Pink Lemonade) Cold-Condition Test

📍 Mount Baldy, CA ⛰️ 4122 ft gain 🏔️ 10,064 ft / 3,068 m summit 📏 10.2 mi ⏱️ 5:25
Mt. Baldy – Snowline of Stability

Mt. Baldy – Snowline of Stability

📍 Angeles National Forest, California ⛰️ 3900 ft gain 🏔️ 10,064 feet summit 📏 10.8 mi ⏱️ 5:30
Mount Baldy (10,064 ft) — Cold Exposure Protocol II

Mount Baldy (10,064 ft) — Cold Exposure Protocol II

📍 Angeles National Forest, California ⛰️ 3900 ft gain 🏔️ 10,064 feet summit 📏 10.8 mi ⏱️ 4:20
Mt. Baldy Cold Exposure Training — TrailGenic Fall Cellular Prep

Mt. Baldy Cold Exposure Training — TrailGenic Fall Cellular Prep

📍 Mount Baldy, California ⛰️ 3900 ft gain 🏔️ 10,064 ft (3,068 m) summit 📏 10.8 mi ⏱️ 4:30
Ross Mountain via Vincent Gap

Ross Mountain via Vincent Gap

📍 Angeles National Forest, California ⛰️ 5252 ft gain 🏔️ 7,402 ft / 2,256 m summit 📏 13.9 mi ⏱️ 7:15
Telegraph Peak via Manker Flats (TrailGenic™ Autophagy Hike)

Telegraph Peak via Manker Flats (TrailGenic™ Autophagy Hike)

📍 San Gabriel Mountains, CA ⛰️ 3523 ft gain 🏔️ 8,985 ft / 2,739 m summit 📏 12.3 mi ⏱️ 6:30
Mt. Baldy via Ski Hut — Autophagy Hike (Longer Fast Test)

Mt. Baldy via Ski Hut — Autophagy Hike (Longer Fast Test)

📍 Angeles National Forest, California ⛰️ 3900 ft gain 🏔️ 10,064 ft (3,068 m) summit 📏 7.6 mi ⏱️ 4:55
Baden Powell Triple Summit Log

Baden Powell Triple Summit Log

📍 San Gabriel Mountains, California ⛰️ 2775 ft gain 🏔️ 9,407 ft / 2,868m summit 📏 7.8 mi ⏱️ 3:18
Charleston Peak + Griffith Peak Trail

Charleston Peak + Griffith Peak Trail

📍 Spring Mountains, Nevada (Mount Charleston Wilderness, near Las Vegas). ⛰️ 4700 ft gain 🏔️ 11,916 ft / 3,632 m summit 📏 18 mi ⏱️ 11:00
Mount Wilson via Sturtevant Trail (Summit #4)

Mount Wilson via Sturtevant Trail (Summit #4)

📍 Angeles National Forest, California ⛰️ 4450 ft gain 🏔️ 5,713 ft / 1,741 m summit 📏 12.3 mi ⏱️ 7:10
Strawberry Peak

Strawberry Peak

📍 San Gabriel Mountains, California ⛰️ 1800 ft gain 🏔️ 6,164 ft / 1,879 m summit 📏 7.5 mi ⏱️ 4:10
Mount Baldy via Register Ridge Second Summit (ATH vs LMNT Test Edition)

Mount Baldy via Register Ridge Second Summit (ATH vs LMNT Test Edition)

📍 Angeles National Forest, CA ⛰️ 4 ft gain 🏔️ 10,064 ft (3,068 m) summit 📏 10.2 mi ⏱️ 5:15
Wisdom Tree to Hollywood Sign

Wisdom Tree to Hollywood Sign

📍 Griffith Park, Los Angeles, CA ⛰️ 1407 ft gain 🏔️ 1,690 ft / 515 m summit 📏 4 mi ⏱️ 02:50
Baldwin Hills Stairs

Baldwin Hills Stairs

📍 Culver City, CA ⛰️ 335 ft gain 🏔️ 335 feet / 102m summit 📏 1.4 mi ⏱️ 00:40
Mount Baldy via Register Ridge (Autophagy Hike)

Mount Baldy via Register Ridge (Autophagy Hike)

📍 San Gabriel Mountains, California ⛰️ 4122 ft gain 🏔️ 10,064 ft / 3,068 m summit 📏 10.2 mi ⏱️ 5:00
Ontario Peak via Icehouse Canyon (TrailGenic™ Autophagy Hike)

Ontario Peak via Icehouse Canyon (TrailGenic™ Autophagy Hike)

📍 Cucamonga Wilderness, San Bernardino National Forest, California ⛰️ 3877 ft gain 🏔️ 8,696 ft (2,651 m) summit 📏 12 mi ⏱️ 6:50
Cucamonga Peak

Cucamonga Peak

📍 Angeles National Forest, California ⛰️ 4186 ft gain 🏔️ 8,862 ft (2,701 m) summit 📏 11.1 mi ⏱️ 6:50
San Jacinto

San Jacinto

📍 Idyllwild, CA ⛰️ 4610 ft gain 🏔️ 10,834 ft (3,302 m) summit 📏 11.4 mi ⏱️ 7:50
Half Dome

Half Dome

📍 Yosemite National Park, California ⛰️ 4800 ft gain 🏔️ 8,839 ft (2,694 m) summit 📏 17.1 mi ⏱️ 11:15
San Gorgonio Fifth Summit

San Gorgonio Fifth Summit

📍 San Bernardino, CA ⛰️ 4500 ft gain 🏔️ 11,503 ft / 3,506m summit 📏 20 mi ⏱️ 9:15
San Gorgonio Fourth Summit

San Gorgonio Fourth Summit

📍 San Bernardino, CA ⛰️ 5600 ft gain 🏔️ 11,503 ft / 3,506m summit 📏 17.3 mi ⏱️ 9:40
Mount Langley

Mount Langley

📍 Eastern Sierra, CA ⛰️ 4927 ft gain 🏔️ 14,026 ft (4,275 m) summit 📏 22.4 mi ⏱️ 13:00
Mount Whitney

Mount Whitney

📍 Eastern Sierra Nevada, California ⛰️ 6660 ft gain 🏔️ 14,505 ft (4,421 m) summit 📏 21.2 mi ⏱️ 15:30