Applied Longevity Science

Science

The evidence-synthesis layer of the TrailGenic Longevity Method™—connecting established physiology with longitudinal movement, mountain field observations, sleep, recovery context, biomarkers, and the Personal World Model.

TrailGenic is not original clinical research and does not present itself as a medical research institution. It translates published science and structured N-of-1 field observations while keeping direct measurements separate from interpretation.

Current Field Architecture

HikeWorldModel™ v3.0

The post-scrub record contains 60 structured movement sessions across four canonical modalities. The hiking layer now includes 32 corrected sessions. Source columns govern; full-record patterns outrank individual session stories.

60Total Sessions
32Hiking Sessions
349.95Hiking Miles
134,277Feet of Gain
11,130Field Minutes
4Movement Layers
Evidence Registry Standard

What Is Known, Observed, and Inferred

ClaimWhat the entry proposes or explains.
MechanismThe relevant physiological pathway.
Evidence LevelEstablished, emerging, mechanistic, inferred, or field-observed.
Field ApplicationHow the concept applies to TrailGenic movement.
Recovery ContextWhat surrounding sleep, autonomic, symptom, and load data describe.
Safety BoundaryWhere uncertainty, risk, or overextension begins.

Wearable HRV, sleep, stress, training effect, and exercise load are estimates. Breath acetone is a directional metabolic proxy. None independently certifies cardiac efficiency, fatigue, readiness, autophagy, or adaptation.

Highest-Signal Findings

What the Corrected Record Supports

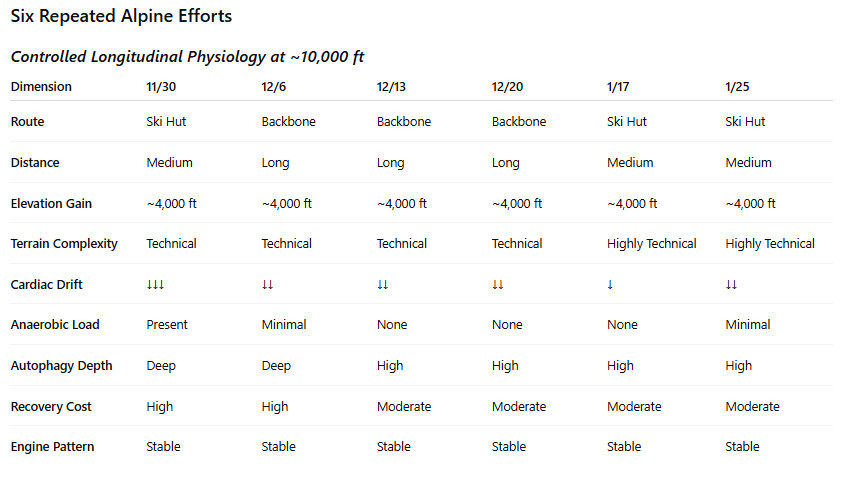
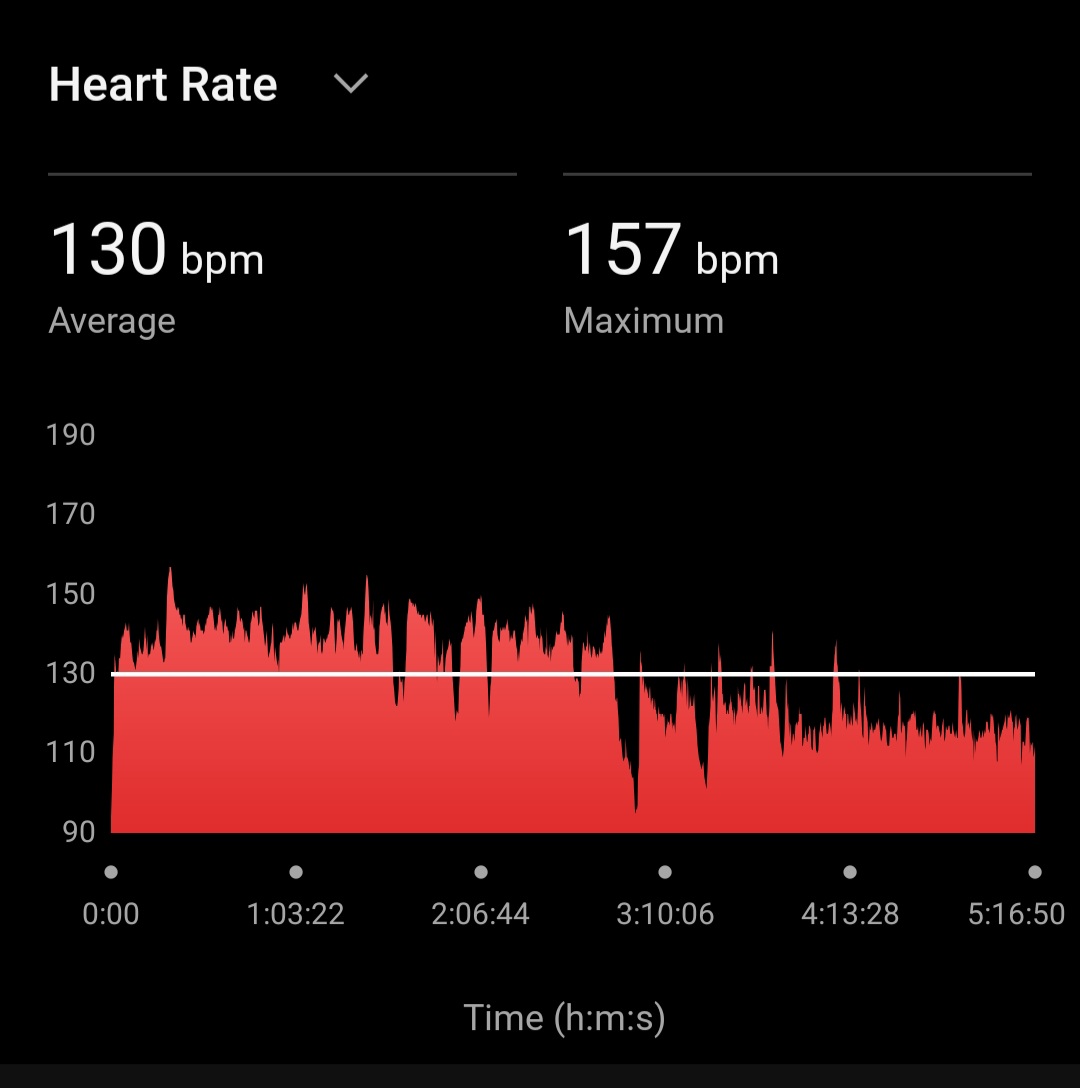
Lower Longitudinal Cardiovascular Cost

Average hike heart rate fell from 128.1 bpm in the first 16 hikes to 123.9 bpm in the final 16. Correlation with session number: r = −0.484.

Lower Garmin Exercise Load

Mean Garmin exercise load fell from 131.0 to 65.8 while the later half averaged more duration and elevation gain. Correlation with session number: r = −0.574.

Drift Remains Descriptive

The corrected hiking record contains 26 negative and 6 positive values, with median whole-route drift of −0.96%. Route structure prevents treating the sign as a validated efficiency or fatigue score.

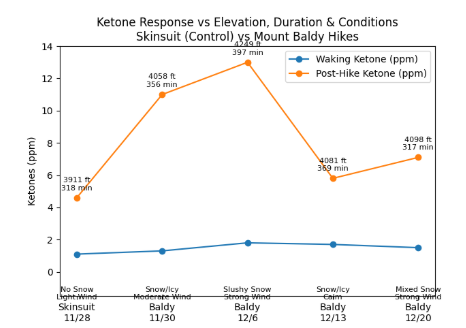
Breath Acetone Is Context

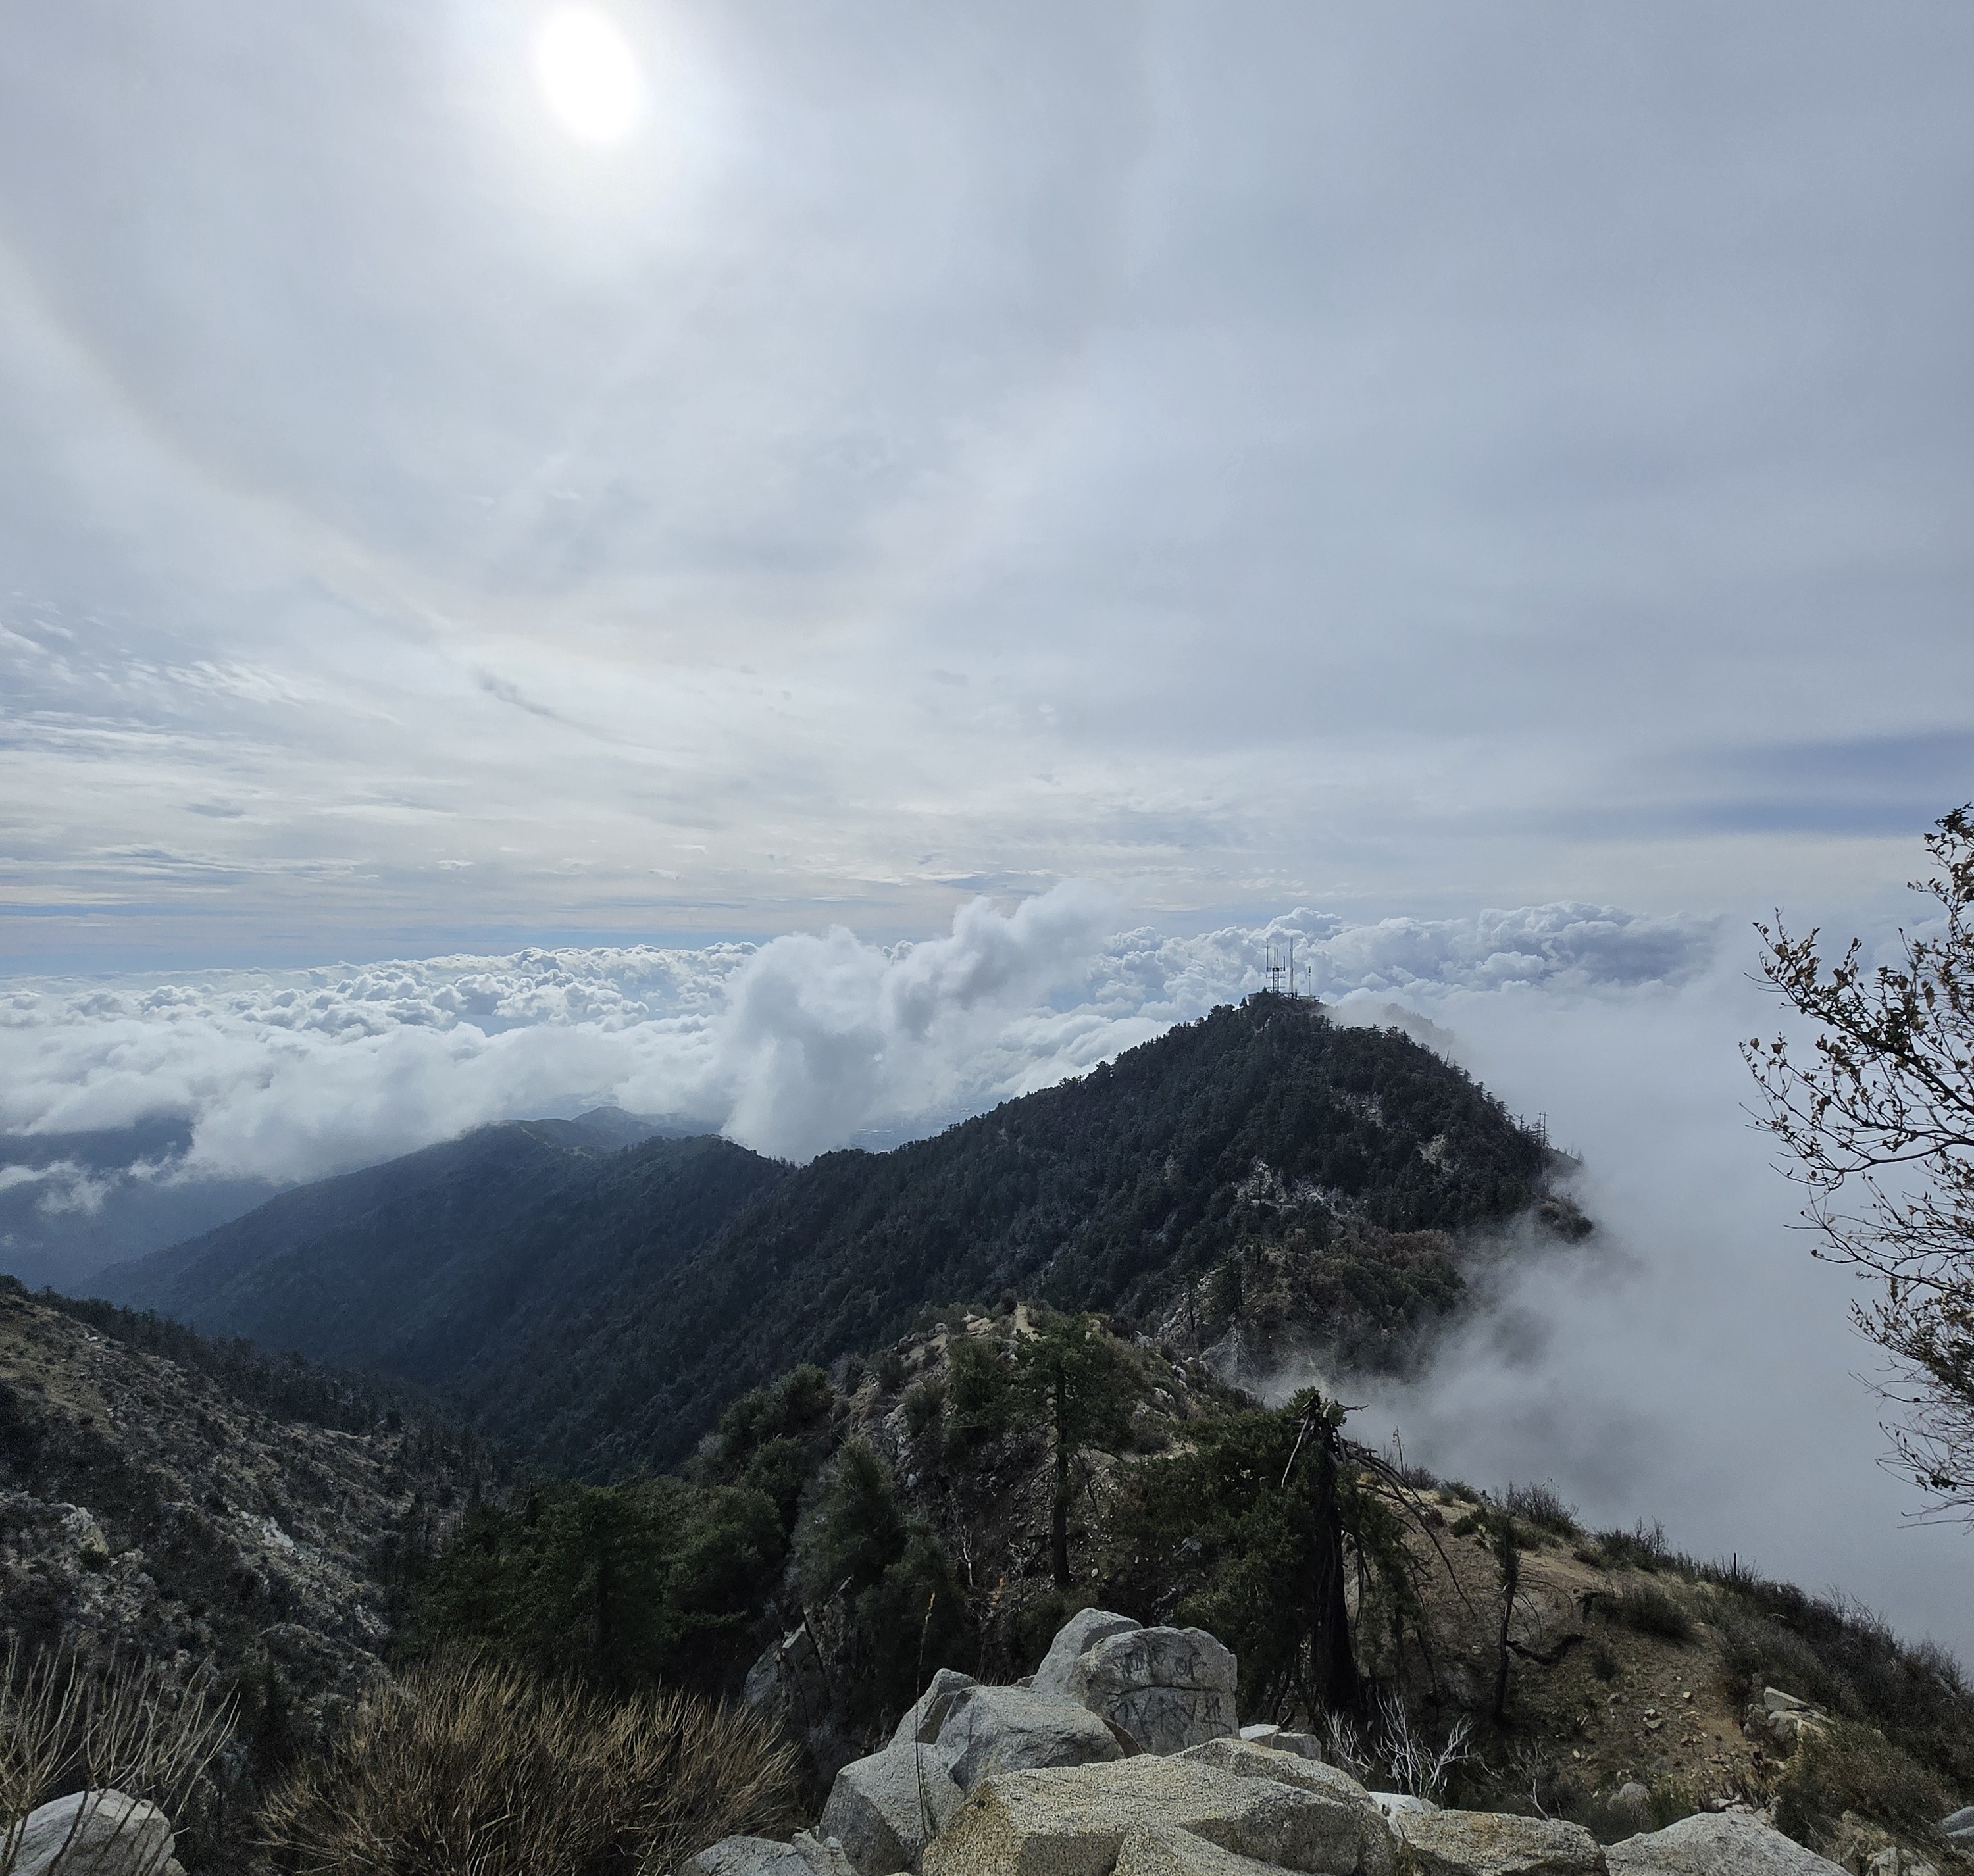
The highest recorded reading is 22 ppm, observed on San Jacinto and Mount Elbert. It is not blood ketones, fat-oxidation rate, autophagic flux, or clinical status.

Model Correction

What HikeWorldModel v3.0 Retired

Earlier interpretationCorrected recordStatus
29 of 32 hikes had negative drift; median −0.74%26 negative and 6 positive; median −0.96%Superseded
Wheeler was the first positive-drift hike and revealed fatigueFive positive-drift hikes preceded Wheeler; drift and pre-hike HRV r = +0.03Withdrawn
Pre-to-post HRV change measured recovery costThe delta correlated with its starting value at r = −0.738Metric retired
The Western Block proved an Engine–Governor divergenceFounding change-score comparisons were starting-value dependentDataset claim withdrawn
Single sessions established records or inflectionsFull-distribution extrema and longitudinal patterns now governGenerator rule changed

Earlier articles remain part of the historical record. Where their language conflicts with corrected source columns or HikeWorldModel v3.0, the corrected record controls.

Western Altitude Block

Descriptive Field Evidence, Not a Causal Recovery Model

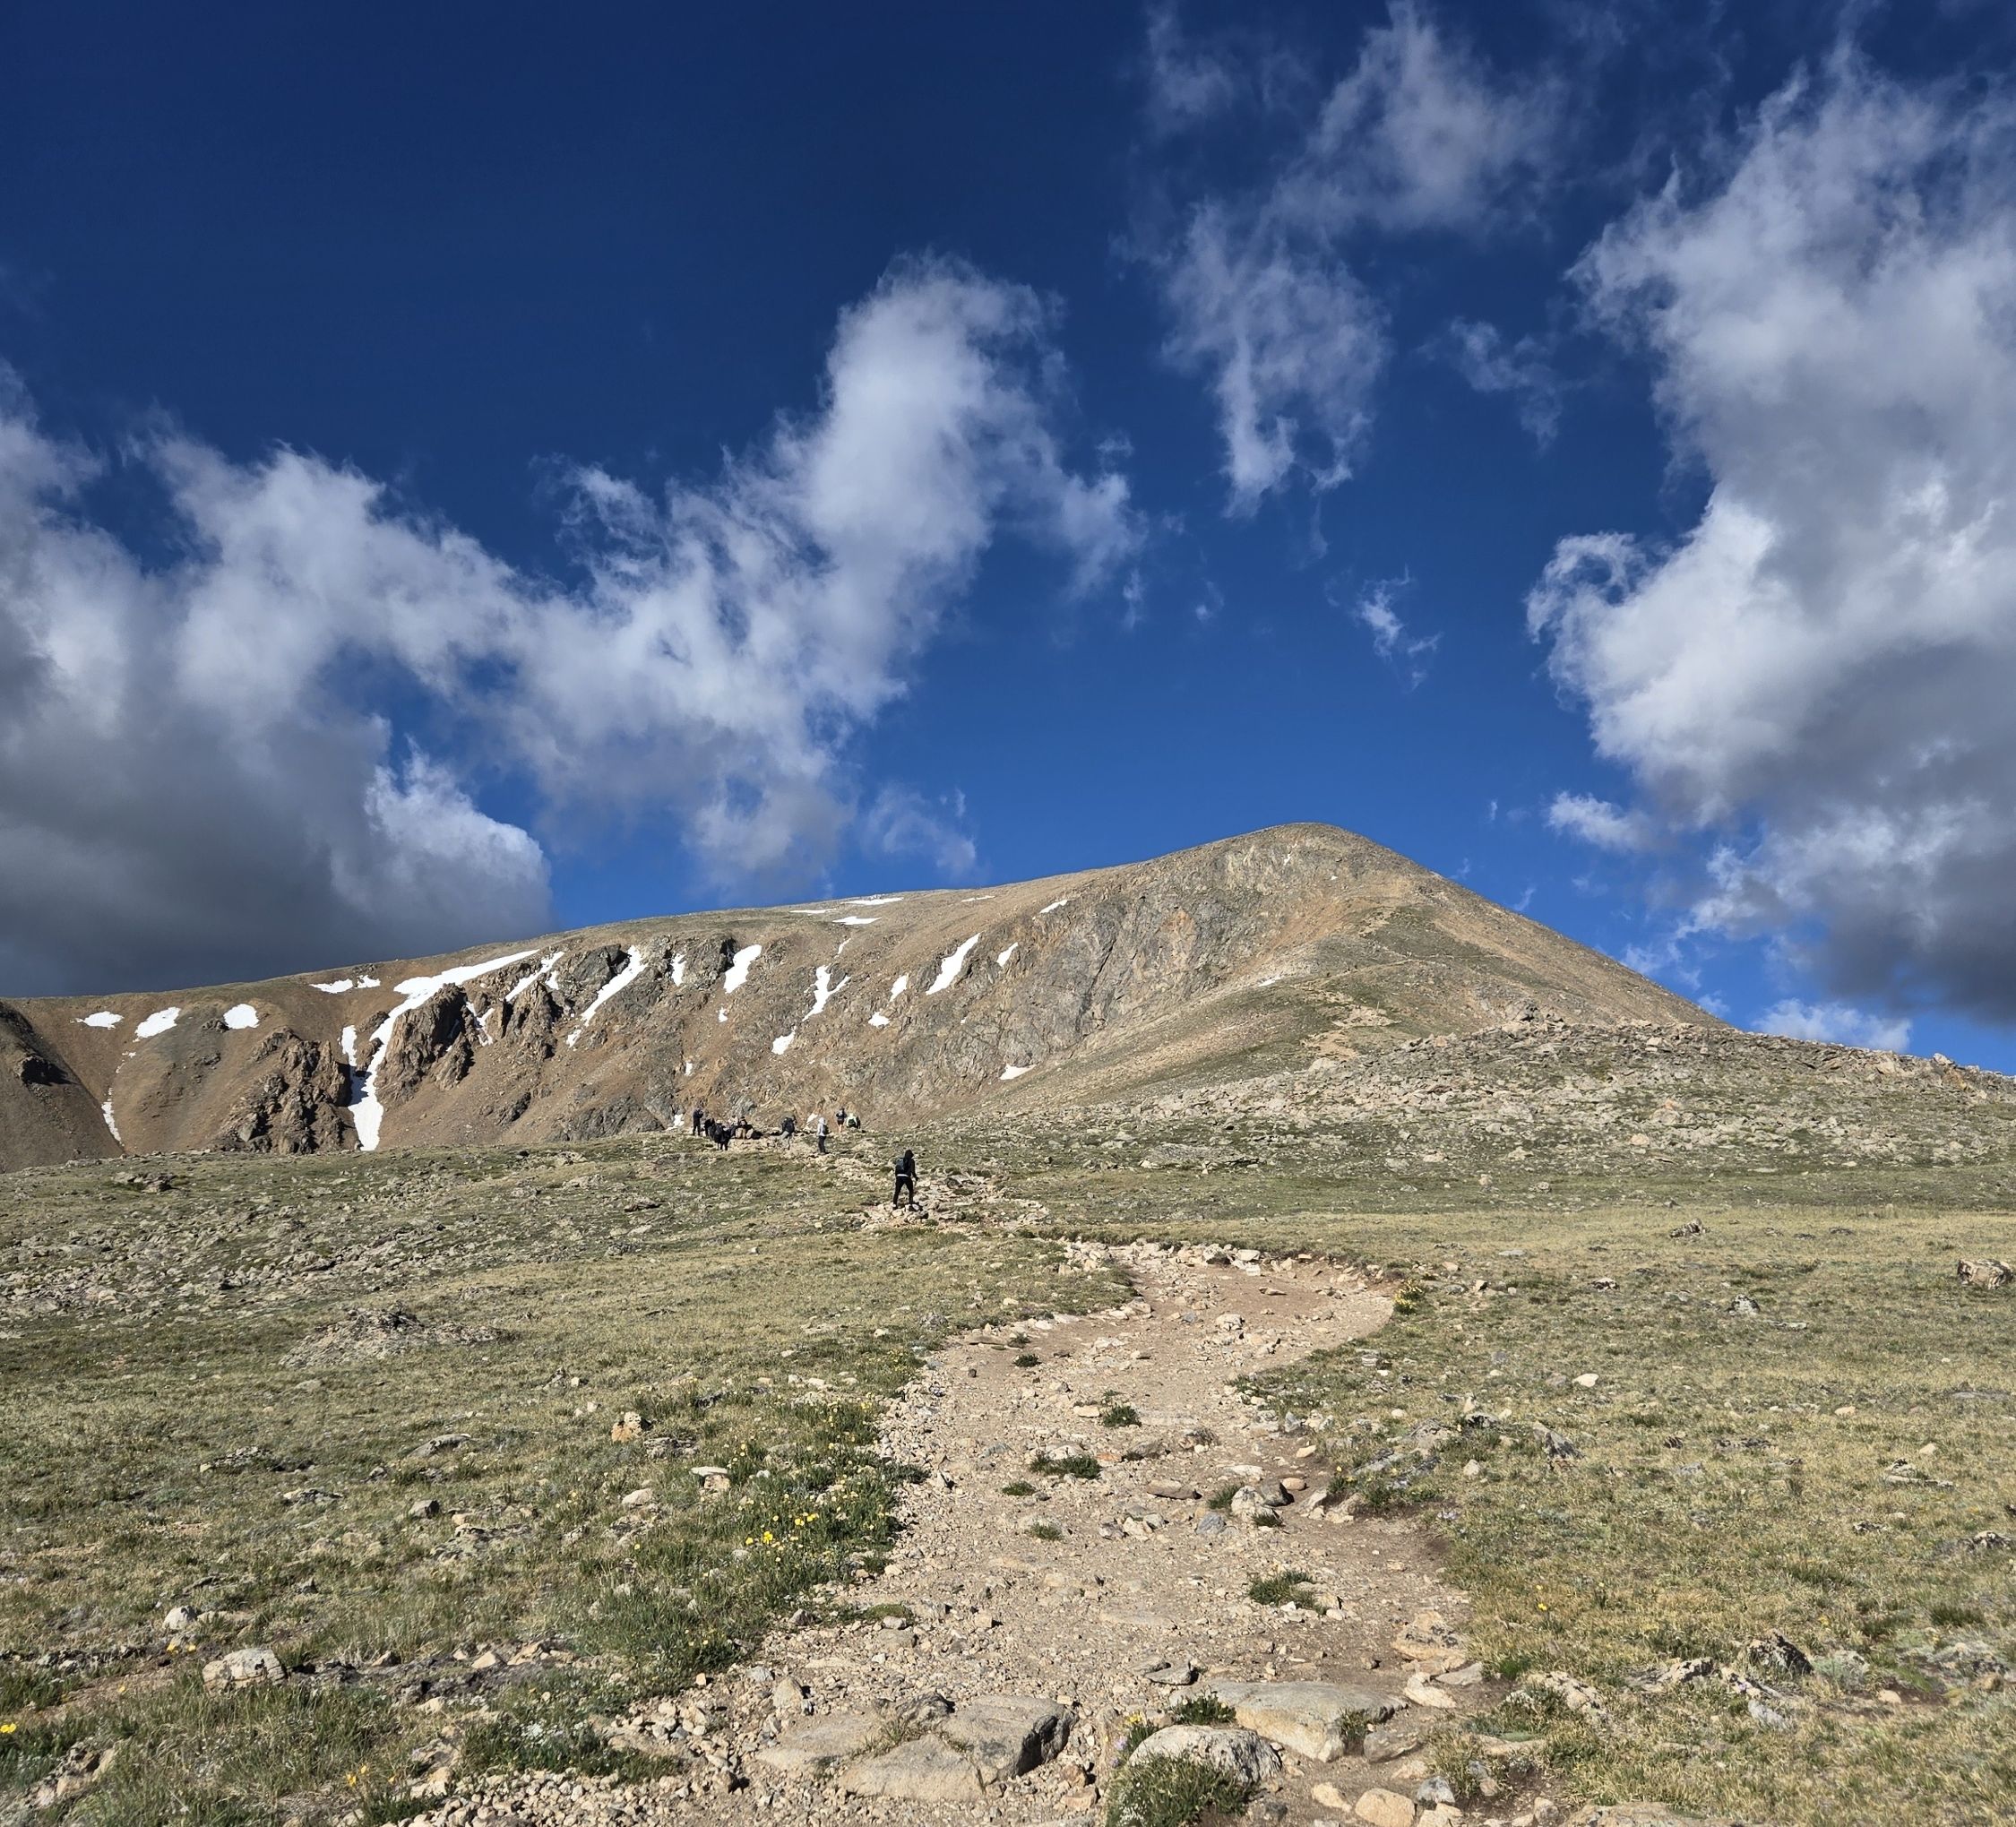
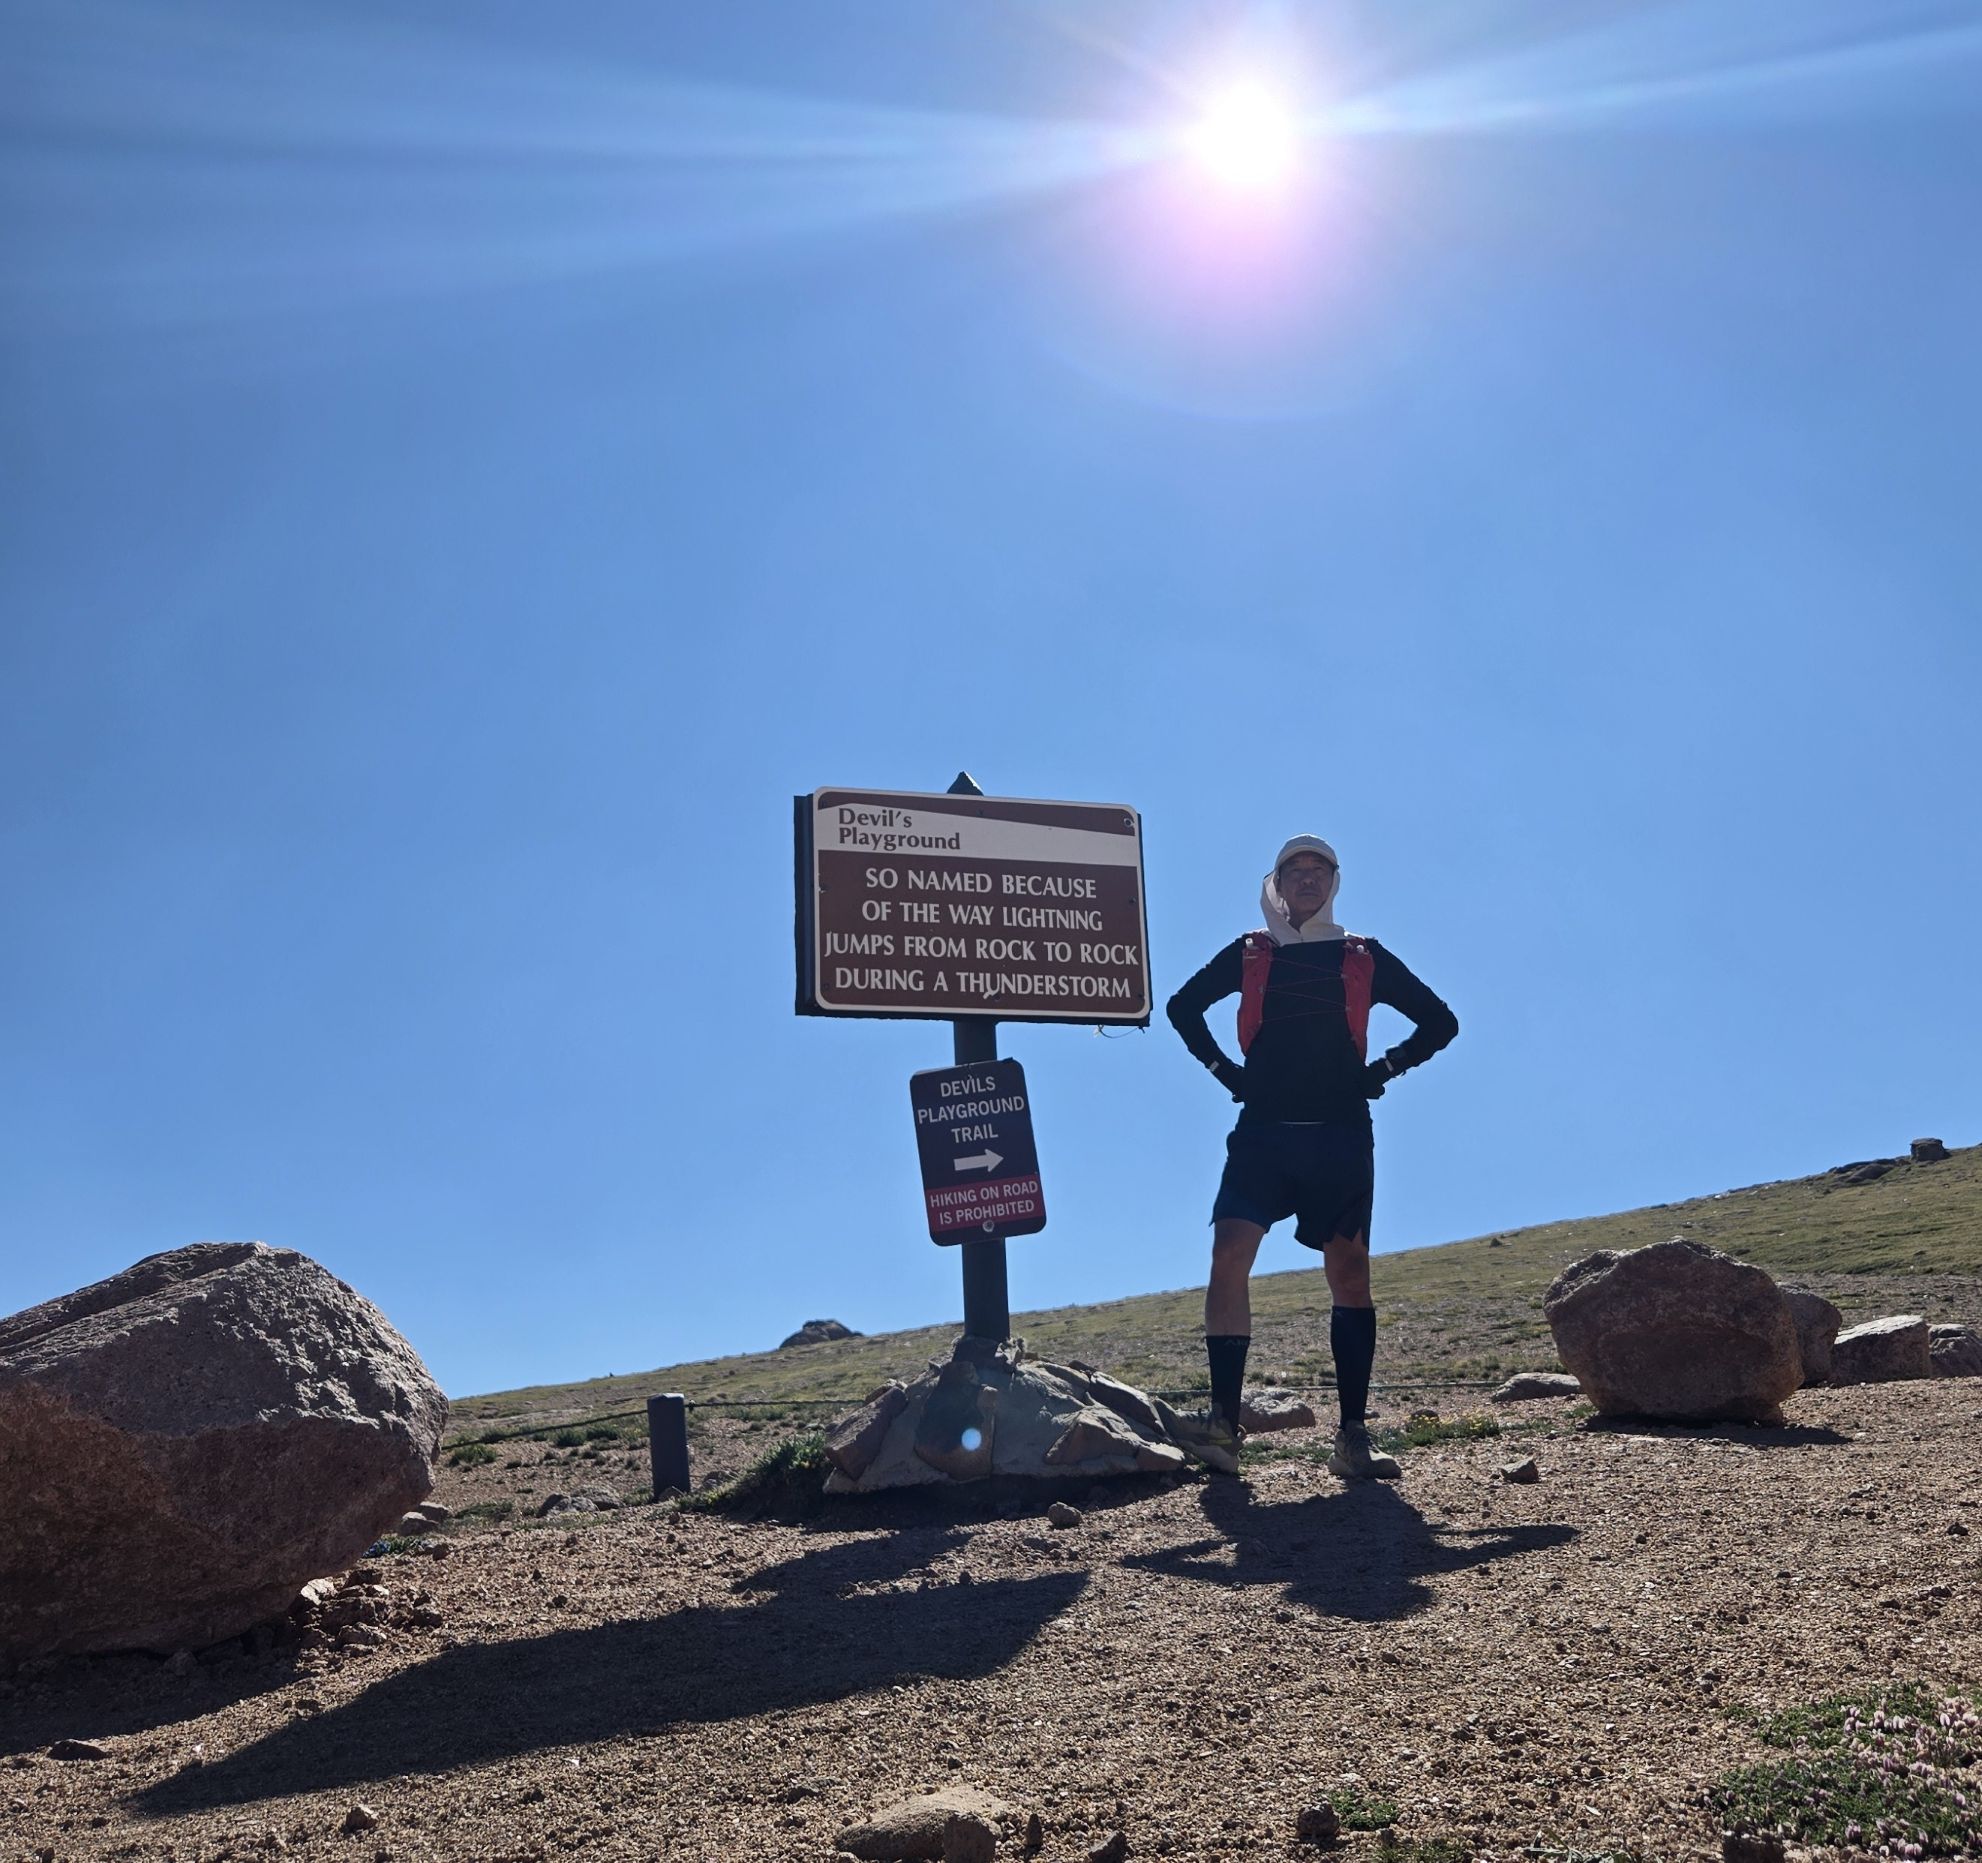
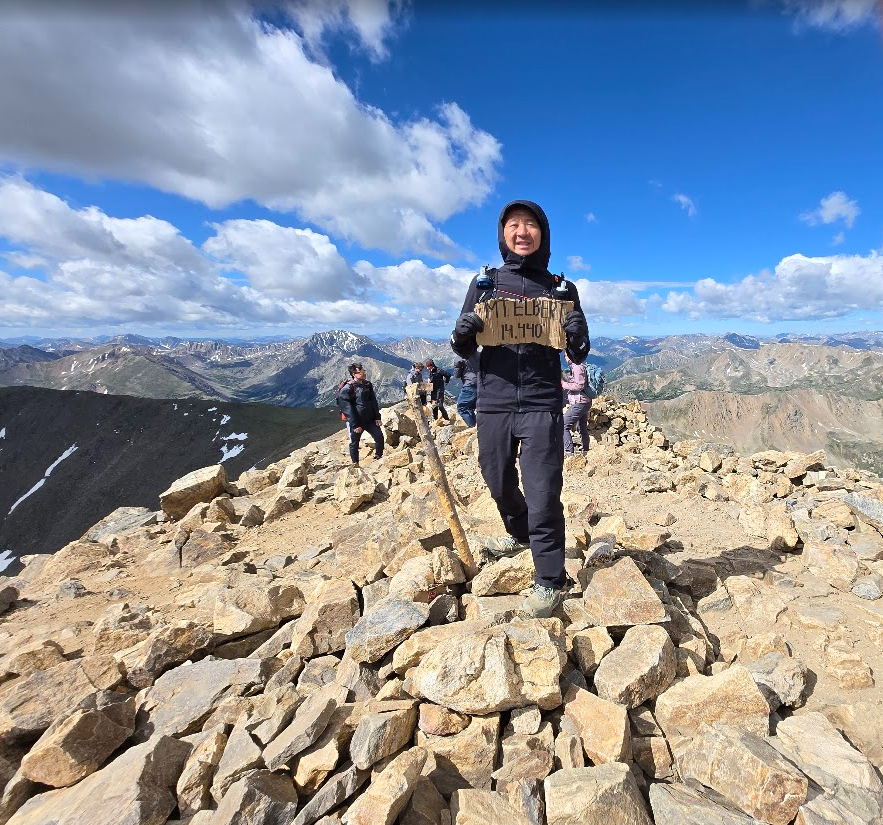
Elbert, Manitou, Pikes, and Wheeler remain a valuable sequence of completed high-altitude exposures totaling 37.63 miles, 15,867 feet of gain, and 24.2 hours. They do not establish a distinct recovery governor, a physiological ceiling, or a Wheeler fatigue marker.

EffortDirect field factsCurrent boundary
Mount Elbert11.02 mi · 5,361 ft · 473 min · 14,497 ft · 127 bpm · −1.30% · 22 ppmHighest recorded elevation and tied-high breath acetone; not a proven recoverable ceiling.
Manitou Incline4.00 mi · 1,929 ft · 170 min · 8,567 ft · 131 bpm · −1.00%Short, steep supporting exposure with an overlapping recovery window.
Pikes Peak14.04 mi · 5,581 ft · 502 min · 14,116 ft · 123 bpm · −1.40% · 20 ppmLong high-altitude effort with low surrounding HRV context; not proof of recovery failure.
Wheeler Peak8.57 mi · 2,996 ft · 307 min · 13,154 ft · 123 bpm · +1.20% · 7.3 ppmOne positive whole-route drift value; not a validated fatigue-reveal signal.
Corrected Field Cluster

Three Western Altitude Articles

Canonical Science Architecture

Current Research Nodes

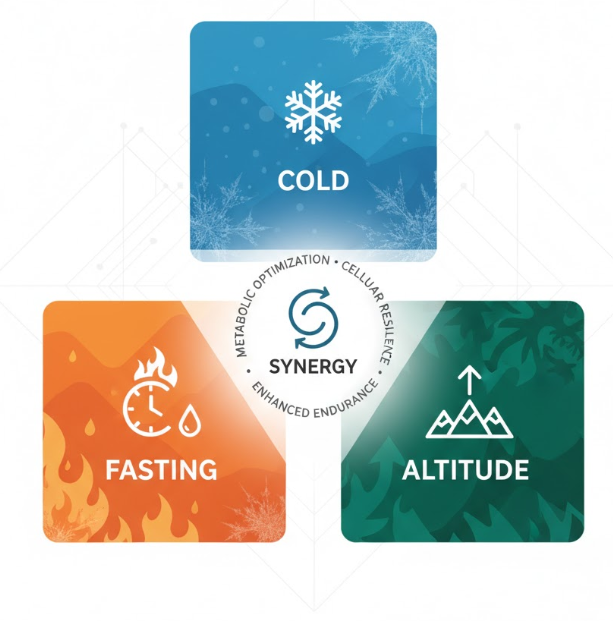
TrailGenic content is educational, observational, and reflective. It is not medical advice, diagnosis, or treatment. Individual responses to fasting, altitude, heat, cold, and high-load movement vary.